JULY 2011 | ||||||||||||||||||||||||||||||||||
| ||||||||||||||||||||||||||||||||||
| The 12-month gain of the composite index in May was 4.4%, the same as in April. The largest 12-month rise was 6.3% in Montreal, followed by 6.2% in Vancouver, 5.6 in Ottawa, 4.8% in Halifax and 4.6% in Toronto. Though Toronto showed the smallest 12-month inflation, it is the only market in which 12-month inflation has accelerated for three consecutive months. Twelve-month inflation decelerated for a fifth consecutive month in Halifax. Calgary prices were down 4.1% from a year earlier, for an eighth consecutive month of 12-month deflation. Given the time lags between home sales and their entry in public land registries, it is possible that the large April and May rises of the composite index were due to front-loading of sales to beat the March effective date of an announced shortening of the maximum amortization period for insured mortgages. This front-loading was very perceptible in Vancouver, incidentally the market with the fastest price index growth from March to May. In June, according to seasonally adjusted data from the Canadian Real Estate Association, market conditions were balanced in the country as a whole while appearing tight in Toronto. Teranet – National Bank House Price Index™ The historical data of the Teranet – National Bank House Price Index™ is available at www.housepriceindex.ca.
The Teranet–National Bank House Price Index™ is an independently developed representation of average home price changes in six metropolitan areas: Ottawa, Toronto, Calgary, Vancouver, Montreal and Halifax. The national composite index is the weighted average of the six metropolitan areas. The weights are based on aggregate value of dwellings as retrieved from the 2006 Statistics Canada Census. According to that census1, the aggregate value of occupied dwellings in the metropolitan areas covered by the indices was $1.168 trillion, or 53% of the Canadian aggregate value of $2.207 trillion. All indices have a base value of 100 in June 2005. For example, an index value of 130 means that home prices have increased 30% since June 2005.
1 Value of Dwelling for the Owner-occupied Non-farm, Non-reserve Private Dwellings of Canada. |
Thursday, July 28, 2011
May 2011 Teranet House Price Index

Wednesday, July 20, 2011
BC Employment by Sector
Below are some graphs highlighting BC's employment over the past 15 years in various sectors, first the goods producing sectors' contribution as a percentage of total employment:

In the goods-producing sector there has been a steady erosion of manufacturing jobs and a steady increase in construction jobs. The recession of 2008-2009 knocked down the number of construction jobs but they still remain elevated compared to previous levels as a percentage of workforce.

On the service side, two items should be of interest, first that health care and educational services are at the top of their ranges. Public administration had been declining until about 2008 and has been increasing since 2010.
Looking at the change in nominal employment year-over-year for real estate and resource-related sectors, first from 1996 to 2003:

Then from 2004 to 2010:

The graphs have been broken up at this level because before 2004 Vancouver was not in a house price bubble as measured by prices compared to incomes and rents. In 2004, construction employment started increasing significantly year-over-year. In 2009 there were significant layoffs across the board, borne mostly by construction but also in the accommodation and food services, transportation and warehousing, manufacturing, and building/business services.
Another measure is how various sectors compare relative to their average percentage contribution. Think of this graph as how far a sector's employment contribution deviates from its 15-year historical average. The higher the number the greater the share the sector contributes, the lower the number, the less.

Construction has remained a significant and above-average contributor to the provincial economy through the recession, ebbing only slightly since 2008, and well above its long-term average. Drilling into other sectors, the two prominent areas showing above-average contribution:

Just so we are all clear where post-recessionary employment contributions have been concentrated.
Tuesday, July 19, 2011
Bank of Canada Keeps Interest Rates Steady
The Bank of Canada has kept its overnight lending rate band at 0.75% to 1.25% but has signaled rising rates are within a tangible horizon. The CAD/USD exchange rate is up over $0.01 on the news. What I always find amusing about national housing and interest rate related stories is how they seem to make it onto the BC regional webpage of CBC's website. The only other city to promote this story to its regional page was Ottawa. I guess one needs to promote stories that concern local readers, though personally I would normally go to their business page for such finance and economics stories.

Monday, July 18, 2011
More on BC Interprovincial Migration
Following a post on BC migration patterns, for completeness, I thought I'd look at the total mobility and the "normalised vector" of mobility. That is, we have been looking at net migration but in terms of real estate activity the absolute number as well as the flux matters. To this end I have plotted total migration volume (inflows plus outflows):

Adjusting for population we can see how migration has compared as a percentage of BC's total population. Here it appears that total volume per capita has remained subdued since 1998.


Alberta contributes around 40% of total volumes in the past decade, a higher portion than before. Taking the net flows and dividing by the total volume produces a "normalised" flux. This tells, in effect, how biased the migration flows are relative to total volumes.

There was a large inflow of migrants from the rest of the country in the early-to-mid-1990s both in total volume and direction.
There was a large outflow of migrants to Alberta from 1997 to about 2001. The mini-real-estate-bust in the mid-90s seems to have been driven not only by a drop in international migration but also a net outflow of residents, mostly to Alberta. There was a the decrease in total volume from non-Alberta regions since 1997, meaning real estate transactions due to inter-provincial migration were somewhat subdued during this time.
The late-2000s have been balanced in terms of migration bias. Relative to total population, migration volumes have not changed much in over a decade, give or take. An interesting exercise is to understand the impetus for the out-migration to Alberta witnessed in the latter stages of the 1990s, and what would instigate such a phenomenon occurring again.
BC Immigration Sources 2005 to 2010
Continuing with population growth analysis, I have drilled into the immigration statistics (available here) and graphed the data of immigration sources by class and country of origin. First are immigration sources by percentage in a given class, the top five classes and countries by intake displayed:

We can see right away that China dominates the investor immigrant class; amongst countries in the "other" category heavily involved in this class are South Korea and Iran. The Philippines dominates the caregiver class. The other classes are more evenly distributed. Next we display all classes:


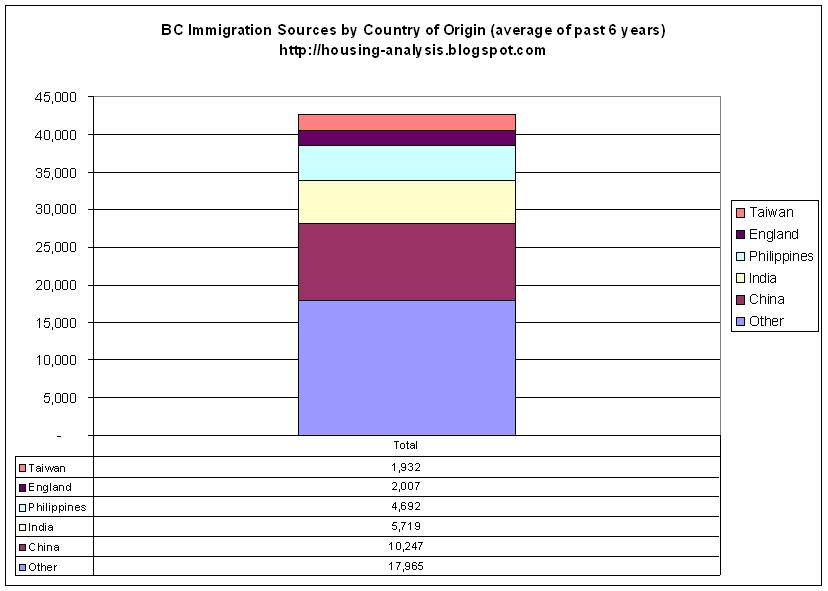
- 2/3rds of immigrants into BC are either skilled worker or family class applicants.
- 13% are investors and entrepreneurs. These classes include the main applicants' spouses or dependants.
- The provincial nominee program has a broad distribution of country of origination.
- China and Taiwan comprised 29% of immigrants into the province. Investors and entrepreneurs (mostly investors) from these two countries comprised 10% of immigrants into the province.
Sunday, July 17, 2011
Friday, July 15, 2011
More on BC Population Growth to 2010
Further to the previous post on BC's population growth, I have parsed the interprovincial migration data, both absolute and change year-over-year, and displayed in graphical format:


From a historical perspective we can observe a few distinct eras in BC's population growth.
- Era 1 1985-1996: Population was driven not only by international immigration but also interprovincial migration, the major components being roughly equally distributed between Ontario, Alberta, and the remaining provinces.
- Era 2 1997-2003: International immigration drastically dropped, around the time of the Asian financial crisis and after Hong Kong repatriation, but notice net provincial inflows ex Alberta stalled and out-migration to Alberta accelerated significantly.
- Era 3 2004-2009: International immigration began to increase again and a steady, though reduced compared to Era 1, flow from other provinces returned.
- Era 4: 2010- : International immigration decreased significantly year-over-year. Inflows from other provinces are subdued compared to Eras 1 and 3.
Of course we cannot conclude the reasons for out-migrating from BC in Era 2 from these data. A dearth in construction witnessed in the last couple of years of the 1990s and first couple of years of the 2000s is at least partially explained by out-migration due to reduced demand for new dwellings. It is unclear whether or not the dearth in construction activity was a significant component instigating out-migration.
Another interesting note is that in 2008, when prices were dropping drastically, there was a surge in international immigration for the next 2 years, which would in itself fuel demand for housing. While not justifying high prices, there is some explanation why inventory has been rather muted until now. In 2011 inventory has remained subdued; the difference for 2011 is that, at least so far, in-migration is no longer keeping apace with recent years.
Thursday, July 14, 2011
BC Population Growth to Q1 2011
BC Stats just released (PDF) its quarterly population estimates and BC is what we would term "sluggish" in terms of population growth.
Population growth consists of the following bulk components:
- Natural increase (births - deaths)
- Net interprovincial migration
- Net international migration
So let's look at how Q4-2010 and Q1-2011 look in a historical context (there is seasonality so quarters are best compared to each other):


The most recent Q1-2011 data indicate the lowest Q1 immigration numbers in 19 years, zero net interprovincial migration, and below-trend non-permanent resident (NPR) in-migration. Q4-2010 saw a net outflow of non-permanent residents of 7,353, who were migrating into the province in the order of 10,000 to 17,000 annually from 2007 to 2009. Now that unemployment has remained elevated for over 2 years, there is, unsurprisingly, pressure to employ local residents; as fallout from this, non-permanent residents have been sent packing.

We can also look at annual population growth to 2010:

In total, 2010 was not a strong year for population growth but nowhere as dire as the low growth witnessed in the late 1990s. We are hearing anecdotes of a weak rental market and these data would suggest that weak population growth in Q4-2010 has extended into Q1-2011 are consistent with a reduced demand for dwelling tenancy. These recent population data are what I would characterise as a somewhat bearish indicator for BC real estate.
Thursday, July 07, 2011
World Housing Bubble
Readers interested in Vancouver real estate should investigate the blog World Housing Bubble "China, Australia, Vancouver Real Estate News".
A recent post concentrates on the divergence of prices between regions of Vancouver:
If we break down detached by area and smooth over four months, we get the following chart (here). Areas of high growth in price:
- Richmond (which appears to be topping out. The REBGV tossed out that oh, it's balancing because it lost $25,000 in value since last month. Really, guys, it's come to this. Houses in Richmond lost 1/7 of the average house price in the U.S., in one month, and that's a "leveling off".)
- Van West (Rip roaring)
- West Van (likewise)
- Burnaby
- Van East (Our old reliable "average" gal)
- South Delta
The rest are making yearly returns close to or below the inflation rate.
The housing bubble in Vancouver is somewhat concentrated and blogger GG has parsed the data to show it. These areas are also areas with a higher-than-regional-average concentration of ethnically Chinese residents.
Monday, July 04, 2011
Greater Vancouver Market Snapshot June 2011
Below are updated sales, inventory and months of inventory graphs for Greater Vancouver to June 2011.
Commentary: the market for the first half of the year has been robust, though in aggregate weaker than in the heady days of 2005-2007. Parts of the Greater Vancouver market are by all accounts hot, others not so much. It appears that condo prices are weaker where detached prices are stronger.
2011 to date has been robust for the detached benchmark. It looks as though the simple linear model -- correlating 3 month moving average months of inventory (MOI) to half-over-half price changes and using it as a predictor of house prices for the month -- is showing some deviation of late in the form of scaling error. The general correlation exists, however, enough for us to anticipate with a high degree of certainty that if the Vancouver market is to exhibit signs of significant distress, it will show up through higher months of inventory, and that we will have ample warning signs before year-over-year price drops start occurring. In the meantime, if you're looking for prices to fall significantly, get comfortable. It will be a few years yet (if ever).
PS if anyone has historical inventory numbers going back to 1998, please let me know. My data only go to 2005.
Friday, July 01, 2011
Bill C-3 Gets Royal Assent
Bill C-3, the one I discussed here, received royal assent on June 26th. This bill includes changing and formalizing how mortgage insurance operates in Canada. Many of the provisions in the bill are not new but were administered through informal agreements now made formal through legislation, though there is much detail that is under the authority and at the whim of the government of the day. Most notably:
- The Ministry of Finance can impose additional capital reserve ratios on CMHC and private mortgage insurers
- The Ministry of Finance can effectively revoke the ability of certain lenders from applying for government-backed mortgage insurance.
- CMHC and mortgage insurers must pay fees in accordance with elevated risk levels it incurs
- CMHC must open its books to the Ministry of Finance
- CMHC's books will be available through FOI if not publicly displayed
- There is a 10% deductible to any funds that are paid by the government to backstop private mortgage insurers. CMHC is 0%
If you have time there are some interesting testimonies from the Parliamentary Standing Committee on Finance sitting on June 20, 2011. Among parties present were Finn Poschmann (CD Howe), Jane Londerville (U Guelph), and Karen Kinsley (CMHC). I highlight a few excerpts for the record, emphasis mine:
Poschmann: Private mortgage insurers, which operate, as I said, in roughly one-third of the residential mortgage insurance market that CMHC does not occupy, have their liabilities guaranteed by the Government of Canada, less a 10% deductible. We could call that a 90% guarantee. This makes it possible for the private insurers to compete in the residential mortgage insurance business with CMHC.CMHC is a crown corporation, the liabilities of which are backed 100% by the full faith credit of the Government of Canada and therefore the federal taxpayer. This means that CMHC's cost of capital is less than it is for the private insurers. In order words, it costs the private insurers more to go to the market to raise money to underwrite the insurance premiums that they, in turn, write. It costs more because they do not have the Government of Canada's backing. But as I indicated, the system works well enough that the existing private insurers tend to hold about 30% of the market. The system more or less works, however imperfectly it may do so.
Dr. Londerville: the CMHC, as a crown corporation, has its mortgage insurance policies implicitly 100% guaranteed by the federal government under the Basel accord. CMHC-insured mortgages, then, require no capital reserves by financial institutions. Clauses 22 and 24 in this act retain the corresponding maximum protection for private companies at only 90%. At the moment, the lender decides who will insure a mortgage loan: CMHC or a private insurer.As a consequence, banks whose loans are insured through a private firm must set aside some capital reserves against the possibility of default by the insurer, which is not a requirement if the loan is insured by CMHC. Thus, rates of return are higher on CMHC-backed mortgages.When profit margins are thin and banks are nervous about capital reserves, as in the financial crisis that began in 2008, this makes a major difference. The evidence of this is in the growth of CMHC's mortgage insurance premium income during 2008 and the drop in Genworth's.Because of the difference in levels of guarantee, each financial institution's treasury or risk officer determines how much of the institution's mortgage insurance business can be sent to private investors, limiting the amount because of the capital reserve requirements. The implication of this for consumers is reduced choice. This is not a competitive marketplace with consumers freely choosing which company will insure their loan, even though they are the ones who pay the large upfront fee for this insurance.CMHC's stated plan for 2010 was to have $520 billion in insurance outstanding, which represents approximately 70% of the market. Genworth has been competing in this market since 1995 and holds most of the remaining 30%. To me, one party with such a dominant share of the market implies inadequate competition. There are now two relatively new competitors in the market to battle for the private company share of insurance. To make this a truly competitive market, changes to the 90% guarantee are necessary, either by reducing CMHC's guarantee or by raising the one for the private sector.
Poschmann: The key point, Mr. Chairman and Mr. Adler, is clarity from the point of view of parliamentary oversight and oversight by the public of the risks to which Canadians are exposed through CMHC's mortgage underwriting and mortgage insurance activities and securitization activities. Again, we have little reason to doubt that the risks inherent in these activities are well managed. However, they are very large numbers, and they're very large risks. If you think about the impact of a significant housing market shock, while CMHC is well capitalized, as Ms. Kinsley has indicated--capitalized, they say, at higher than the standards that OSFI requires, so we should be well protected as taxpayers--nonetheless a significant market shock could easily eat up the capital that CMHC has set aside.
I see the key points from this testimony as:Kinsley: The issue of the differential in our mandate and the cost of that really gets to the nub of the difference in the guarantee between CMHC and the private insurers. We are, by virtue of being a crown corporation, 100% guaranteed by the Government of Canada. Recognizing that private insurers can select the markets they choose to be in, and obviously they will not serve those that are less profitable, the government has set the guarantee for private insurers at 90%. That 10% differential in the guarantee, in order to create a level playing field between us, compensates us for that difference.We have been able to operate successfully on that basis, as is evident by our annual returns, and the over $12 billion that we've been able to return to the government.
- CMHC enjoys a reduced cost of capital. Londerville argued convincingly that this produces an unfair advantage for CMHC compared to private insurers who will either accept higher risks with lower premiums or give up market share. That CMHC commands 70% of the market means they set the price.
- Banks are transferring significant risk provisions onto CMHC via the 100% guarantee. This means they do not need to provision for counterparty risk on their balance sheets. As was mentioned this was somewhat helpful in 2008 when banks were scared of counterparty risk. The 100% guarantee does not show up on the balance sheets of those making the loans.
- CMHC is well capitalized and can withstand a moderate housing recession without touching government coffers. A severe recession would likely wipe them clean, and they would be asking for some of the expropriated monies back, though it's a bit funny that a corporation would be asking its shareholders for dividend clawbacks. (Imagine if RBC asked shareholders for its dividends back!)
- Kinsley opines that the 100% guarantee is necessary to compensate CMHC for providing mortgage insurance when private insurers are unable or unwilling to provide insurance in certain market segments. The problem here is that there is no condition by which an outsider can determine which markets are "distressed" enough that private insurers refuse to step up, and one major reason why CMHC commands the market share it does.
I would recommend to policymakers that CMHC's function of providing access to housing (and not necessarily mortgage insurance) in times when the private market is dysfunctional is noble but there must be limits. When its mandate starts encroaching on mainstream market functions, by underwriting 70% of a market that by all accounts is functioning as it should -- private insurers (well, insurer) are competing -- it risks usurping its mandate. In the extreme, as is potentially the case now, when house prices are high, CMHC can only fulfill its affordability mandate by taking on more risk, when it should be focused on lowering, not enabling high, prices.
The other elephant in the room is that Canada has not yet experienced a moderate or severe housing recession in 20 years, and certainly not when interest rates are so low. While we can opine that CMHC is well-capitalized and that, perhaps, making mortgage insurance fully private may help against future asset price bubbles, we do not have an example that can be reasonably used as a passable stress test. Australia was cited as a country that privatized its mortgage insurance business about 15 years ago, but Australia has not experienced a severe housing recession under this regime to validate private insurers' capital adequacy requirements. In other words, thinking that insuring against correlated risks can be privatized should be thoroughly vetted against potential housing market shocks in hundreds of years of world history. In my view, the best way to prevent governments from bailing out insurers is attempting to avoid the risk entirely, and that means using lower prices and higher yields as a fundamental gauge to set housing policy.
With Bill C-3 now emerging from the legislative sausage-maker its implementation will hopefully pave the way for recasting CMHC's important but dangerous role in Canada's housing market.
Subscribe to:
Posts (Atom)