Showing posts with label building starts. Show all posts

Tuesday, October 09, 2018

Metro Vancouver Housing Construction Activity Update September 2018

The stalwart Metro Vancouver housing starts and completions graph (conceived by Van Housing Blogger over a decade ago) has been updated for including preliminary housing starts data from September 2018:


The total number of starts has continued to be very strong through 2018. Completions have increased to record highs the past year, and it is reasonable to assume that many of these have started showing up, directly or indirectly, on the MLS-brokered market and have contributed to a moderate increase in new listings for used homes. In my previous post I noted that the market has cooled and we may not be free of this weakness for some time (though who knows for sure?). Developers might be "building into" a protracted downturn.

These graphs highlight how unprecedented current construction activity is. This activity has led to acute shortages for trades and backlogs in approving permits and inspections. This should come as no surprise to anyone — this is how market cycles are supposed to work. 

What is of interest to policymakers and governments here is how long it takes to render new supply onto the market. Not shown here is the time required to acquire land, plan the site, rezone, and get approval; the actual "project start" is far in advance of the starts shown in the graphs above. Ramping up supply takes years, but a sudden change in demand can occur in a single season. In addition, historically when units don't sell, there is significant impedance to commence new starts or even the preamble work, which makes it very difficult to keep a steady supply of abundant housing in the pipeline to prevent shortages, at least not without significant supplementary government intervention. I am concerned some facile interpretations of housing economics may not be well versed in the grim realities of recessions and how difficult it is to maintain over-supply and thus bypass the shortage portion of the cycle. Food for thought.

Sunday, June 15, 2014

April 2014 Residential Construction Activity - Vancouver CMA

Below are CMHC starts, completions and under construction for Vancouver CMA to April 2014. Starts and completions are displayed as 12 month sums (included May preliminary housing starts):
No signs of a downturn...


Monday, March 10, 2014

January 2014 Residential Construction Activity - Vancouver CMA

Below are CMHC starts, completions and under construction for Vancouver CMA to January 2014. Starts and completions are displayed as 12 month sums (included February preliminary housing starts):
Here is single detached under a microscope, including completed but unabsorbed units:
While single detached starts and completions are below levels seen before the recession, units under construction and unabsorbed inventory are both higher. These datasets do not indicate where single detached units are being built, but many if not most will be on previously unoccupied land, the remainder will be infill. Rumours of "strength" in "single family" house prices in certain areas do not align well with these data.

Another point to make is that CMHC-reported "single detached" will include houses with secondary suites. Houses with occupied secondary suites that were counted as "single detached" by CMHC and municipalities are counted as multifamily by Statistics Canada when performing census dwelling counts. Interestingly those same dwelling counts will count laneway houses as "single detached" (which of course they are since they share no walls, ceilings or floors with anyone but the mice).

Wednesday, October 23, 2013

September 2013 Residential Construction Activity - Vancouver CMA

Below are CMHC starts, completions and under construction for Vancouver CMA to September 2013. Starts and completions are displayed as 12 month sums:
The first graph below is completed but unabsorbed inventory for single and semi detached properties, the second graph is showing the sum of single and semi detached under construction and completed but unabsorbed, which provides a proxy for near-term inventory of new properties of that type. (Single and semi-detached typically have construction cycle of less than a year.)
By the unabsorbed plus under construction measure, single and semi detached inventory has been at a level unseen since the early 1990s since early 2013.

Monday, September 09, 2013

City of Vancouver Permit Data to July 2013

Below are data graphed from the City of Vancouver's Statistics on construction activity.

The following graphs are broken up by residential permits and value, by source: multi, single/duplex, and laneway. I have also graphed demolitions and alteration/repair/addition permits. (Click on images to enlarge.)

Below are construction permits based on value by source, first in absolute terms and second is the relative distribution:
Notes:
  • Laneway housing permits have surpassed 1,000. July saw the largest number of laneway permits issued since the type's inception in 2009, at 75.
  • There were no multi-unit construction permits recorded in July. This may be an error.
  • Total permit value to date is $1.20 Billion, which is down from $1.47 Billion this time last year.

Wednesday, August 28, 2013

Population Growth and Residential Construction Activity in BC

(This is the first in a three part series analysing population growth and construction activity in BC. See the second and third parts.)

There is an obvious correlation between housing activity and population growth. Since the 1980s one can see the ebbs and flows of population growth, alongside housing starts and completions, have been a normal occurrence in BC's history. The second graph puts population growth in a longer historical perspective for posterity.

 
The best correlation is between housing completions and population growth, however there are two behaviours, one pre-2000 and another post-2000. Pre-2000 there were approximately 0.22 completions per person of growth, with a 1 quarter lag (ie population growth rises and falls one quarter before completions). Post-2000 there were approximately 0.33 completions per person of growth with a 3 quarter lead (ie population growth rises and falls three quarters after completions).
Some clues as to why there is a difference should be evident by observing the fraction of detached completions of the total has been dropping since the early 1990s in Vancouver that makes up the majority of residential construction activity in the province.

Notes:
  • Though it's not immediately evident from the data, by visual inspection, there is arguably a "baseline" 10,000 units built each year to maintain the existing stock of housing for the existing population. That is, if population growth were zero there would still be a turnover demand of around 10,000 units per year.
  • The number of completions per person of growth after 2000 corresponds to 0.33, or about 3 people per completion. Before 2000 this was 4.5 people per completion. It looks as if the shift to multi-unit construction at least partially accounts for this difference.
  • As a rough rule of thumb, if population growth is 30,000 this results in annual housing demand of 20,000. Over the course of BC's history since the 1960s, 30,000 is a typical nadir. Most recent population growth has been around 40,000, which corresponds to a demand of about 22,000-25,000 units. Current completion rate is near the high end of this range but the number of starts suggests the number of completions will not markedly deviate from current population growth.
  • Population projections typically do not account for the variability in year-to-year population growth but concentrate on averages. Population growth has averaged 60,000 and completions have averaged 28,000 since 1965. Growth projections are about 55,000–60,000 until 2035 based on BC Stats analysis. Population growth cycles with a period of about 10–15 years.
I track population growth closely as it aligns with residential construction activity, GDP growth, and new and used housing sales and for-sale inventory.

Wednesday, May 22, 2013

City of Vancouver Permit Data to April 2013

Below are data graphed from the City of Vancouver's Statistics on construction activity:
An interesting measure is to cross-correlate the Teranet HPI to single family detached permits, producing an RSQ of 0.94. Although it's not obvious in the graph, the HPI will slightly lead the change in building permits. If the HPI rose/dropped that means building permits were likely to rise/drop in  about 1-2 months:
There is more supply on the horizon, though single family permits have waned of late. Somewhat strange is the marked increase in the value per permit of 1+2 dwelling constructions, that have doubled in the past four years. If I were to guess I would say this is due to how dwelling costs are reported and the mix of dwellings, more than an increase in construction costs.

Monday, January 21, 2013

City of Vancouver Permit Update for November 2012

I have been producing some graphs starting in early 2009 showing the trend of permits in the City of Vancouver. Here is an update to November 2012.

Residential dwelling permits graphed since 2007:
Permits parsed for 1-2 dwelling units only (i.e. single family, single family with suite, and duplex):
Multi-unit building permits:
All permits' value, residential and commercial:
Value per permit, multi and 1+2:
Demolitions:
There seems to be no slowdown in construction activity for the next while.

Below are 12 month moving average 1+2 dwelling permits plotted with the Teranet HPI. There is a 6 month shift in permit data due to the 12 month averaging filter; if one accounts for that the correlation is 0.95. Something to think about.
(Note: graph not started from zero to highlight correlation)

Wednesday, August 29, 2012

City of Vancouver Permit Update for June 2012


I have been producing some graphs starting in early 2009 showing the trend of permits in the City of Vancouver (here and here and here and here). Here is an update to June 2012.

Residential dwelling permits graphed since 2007:
Permits parsed for 1-2 dwelling units only (i.e. single family, single family with suite, and duplex):
Multi-unit building permits:
All permits' value, residential and commercial:
Value per permit, multi and 1+2:
Demolitions:
Analysis:

  1. The value per permit for detached has almost doubled since 2008. It is unclear why this is occurring, but is likely a combination of higher-end properties being built. If laneway houses are included in the value per permit this would contribute to a higher value per permit. I am unsure if this is the case. Multi-unit value has also crept up meaning the way by which permit value is accounted may have changed.
  2. Demolitions are approaching recent highs again.
  3. Dropping land values destroy detached building activity.
  4. Tightened credit conditions in 2008 are evident in the multiunit permit applications. This is not occurring in 2012.

There seems to be no slowdown in construction activity for the next while.


Edit: Below are 12 month moving average 1+2 dwelling permits plotted with the Teranet HPI. There is a 6 month shift in permit data due to the 12 month averaging filter; if one accounts for that the correlation is 0.95. Something to think about.
(Note: graph not started from zero to highlight correlation)


Monday, October 03, 2011

City of Vancouver Permit Update for August 2011

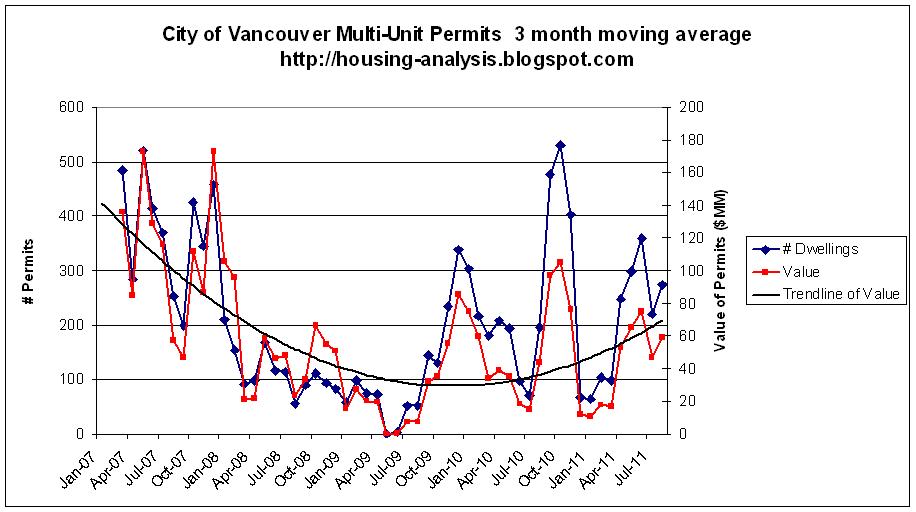
I have been producing some graphs starting in early 2009 showing the trend of permits in the City of Vancouver (here and here and here). Here is an update to August 2011. (August data are here (PDF).)

(Note on methodology change. I have plotted the 3 month moving average of permits to better show the underlying trend.)

Residential dwelling permits graphed since 2007:


Permits parsed for 1-2 dwelling units only (i.e. single family, single family with suite, and duplex):

Multi-unit building permits:

All permits' value, residential and commercial:

Analysis:

1. There has been a sustained rebound in multi-unit permits starting in late 2009 and continuing into 2011.
2. The detached construction market is hot right now.
3. As I stated earlier this year, "I would not be surprised to see detached permit applications rebound going into the first half of 2011." And... yes.
4. Laneway housing, though not explicitly tracked by me, continued its upward trend. As I mentioned last time, "I would expect to see a continued increase in laneway housing permits, barring any major pullbacks in the availability of credit." This has turned out to be correct.
5. Total construction value, including residential and commercial, is not high by historical measures.
6. Given increased multi-unit construction in 2010 and detached construction in 2011, I expect increased dwelling supply entering the market in early 2012.