This blog often deals with subjects that border on the abstract when it comes to the nuts and bolts of real estate investing. I recently viewed a spreadsheet used by a full-time real estate investor, one also used by many of this investor's acquaintances in the same line of work. This post is devoted to me explaining what factors they are using in their spreadsheet to calculate returns.
I will be focusing on a spreadsheet for the so-called "buy and hold" strategy -- buy, rent out, and hold indefinitely. We do not assume the property will be sold any time soon but, of course, capital appreciation comes in to calculating total return. So lets get into it.
(Note, I do not have permission to share this spreadsheet directly, however I will summarise how its calculations are performed as well as what inputs are used.)
Purchase Price
The first input into the spreadsheet is purchase price. We add into this closing costs and taxes, as well as any renovations that need to be performed before occupancy:
Total Price = Purchase Price + Closing Costs + Renovations
Revenue (Rent)
The major source of revenue for a property is rent. Here we use the anticipated annual rent from the property. There may be additional income sources, including: parking, vending, storage, interest income (e.g. on capital reserve), laundry, et cetera.
Operating Expenses
Operating expenses are the ongoing costs of maintaining the property. These would include property taxes, insurance, vacancy loss, advertising, repairs, management, strata fees, etc.
A big operating expense that is often overlooked by much of the analysis I see online is the so-called "capital cost allowance" which is effectively building up a reserve for capital replacement. This is, in the extreme, building up a reserve for building replacement but also includes large or small renovations that inevitably occur as the building ages.
Calculations
After determining our purchase price and costs, revenues, and operating expenses, we can calculate a few common values used by investors to determine their return. These are listed below:
Net Operating Income (NOI) = Revenue - Operating Expenses
Cap Rate = NOI/(Purchase Price) *
Gross Rent Multiiple (GRM) = (Purchase Price)/Revenue
* Note one can substitute Purchase Price with Total Price.
None of these calculations take into account financing. They are straight calculations on the investment's operations. They are also based on current, not future, operations; rent or operating expense increases are not calculated. GRM is analogous to the "price to rent ratio" that local commenters like to refer to. (A price to monthly rent ratio R would be equal to GRM*12.)
Debt Service and Financing
Financing is simply where the money to purchase the property comes from. It is either from the investor directly or through borrowing from a lending institution. Total debt servicing is an expense. Debt servicing costs are highly dependent on the interest rate. For longer term calculations, this interest rate may need to be modified to account for higher or lower rolled over financing costs.
Closing costs is the amount of cash required to complete the purchase, equal to Total Cost - Debt. A typical amount for closing costs would be, say, 25% of Total Cost, though other ratios are of course possible.
Capital Appreciation
Like most property, there will be some capital appreciation, usually expressed as an expected average percentage gain year-over-year.
Calculations after Financing and Appreciation
In a nutshell, a total return is comprised of: cash generation, debt repayment, and appreciation. After 1 year:
Cash on Cash Return (COC) = NOI/(Closing Costs)
Equity = (Purchase Price)*(1+Appreciation) + Cash - Debt
Return on Equity (ROE) = NOI/(Equity)
Total Return on Investment = Equity/Closing Costs - 1
NOI is annualised.
Stuff Not Done
As mentioned, there are things that are not calculated. Rental and expense increases, as well as debt repayment schedules are not calculated. There is a good reasons for this, in this particular case. The philosophy is that if the return after the first year is not positive, it generates no income for the investor. This is not sustainable without a large pool of cash to finance the shortfall -- these particular investors want to produce income.
Summary
Above are some of the formulas used by full-time residential property investors to calculate an investment's return. You can plug any property you see for sale on the market into these formulas into and come up with some typical figures, then play around with the financing costs and appreciation (both these have high sensitivity when it comes to calculating return). I'll go through a simple example next time.
These investors own property locally and are actively looking to invest in property in the current market. If you want to know who is looking to buy, it helps to understand what calculations and analysis they perform to determine a property's value and under what conditions they would buy.
Friday, July 16, 2010


Tuesday, July 13, 2010
Effect of interest rates on affordability under new CMHC rules
Since April 19th, CMHC insured mortgages must qualify under the posted 5-year mortgage rate.
Here is the evolution of the five year posted rate and the five year bond yield over the past two years.
 Notice that the yield has dropped around 3/4 of a point since April, but the mortgage rate has not. I guess the banks haven't passed on their savings--so far anyway.
The 5-year posted rate has changed a bit over the three months since the BIG April 19th CMHC rule change. From 6.1% we have moved down to 5.79%. What impact does that have on the maximum people can pay?
Assume the following. 100K of income. 35 year amortization. 40% total debt service ratio, here interpreted as you can pay 40% of your gross income for your mortgage. 5% down.
With these assumptions at a 6.1% qual rate, you can afford to pay $614,666, comprised of $583,933 borrowed and $30,733 downpayment.
As we have moved from 6.1% to 5.79%, what has been the impact on the amount you can pay, given the above assumptions? See the graph below.
 I've put it as an index in the axis, so that percentage change is easier to calculate. I also labeled the first and last points with the dollar value. The ability to pay has gone up by 3.6 percent from April 19th to now.
This graph isn't too exciting yet--but with big swings in the mortgage rate, either up or down, this could be a fun one to look at again in the future.
Here is the evolution of the five year posted rate and the five year bond yield over the past two years.
 Notice that the yield has dropped around 3/4 of a point since April, but the mortgage rate has not. I guess the banks haven't passed on their savings--so far anyway.
The 5-year posted rate has changed a bit over the three months since the BIG April 19th CMHC rule change. From 6.1% we have moved down to 5.79%. What impact does that have on the maximum people can pay?
Assume the following. 100K of income. 35 year amortization. 40% total debt service ratio, here interpreted as you can pay 40% of your gross income for your mortgage. 5% down.
With these assumptions at a 6.1% qual rate, you can afford to pay $614,666, comprised of $583,933 borrowed and $30,733 downpayment.
As we have moved from 6.1% to 5.79%, what has been the impact on the amount you can pay, given the above assumptions? See the graph below.
 I've put it as an index in the axis, so that percentage change is easier to calculate. I also labeled the first and last points with the dollar value. The ability to pay has gone up by 3.6 percent from April 19th to now.
This graph isn't too exciting yet--but with big swings in the mortgage rate, either up or down, this could be a fun one to look at again in the future.
Monday, July 05, 2010
REBGV Statistics - June 2010
The Real Estate Board of Greater Vancouver released the monthly statistics package for the month of June 2010. Active listings held firm at relatively high levels. Sales were not strong for various reasons. Months of inventory rose to just about 6. Prices have fallen for 2 months now. The market looks very weak and set to weaken further with sales falling in the normal seasonal pattern and active listings remaining high.


Fraser Valley Real Estate - June 2010
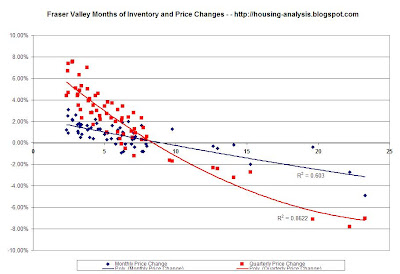
The Fraser Valley Real Estate Board has released their monthly statistics package for June 2010. Active Listings fell and Sales grew during June compared to May. Months of Inventory fell and prices rose very slightly.




Monthly Stats
I expect that today or tomorrow will bring about the monthly release of statistics from the Fraser Valley and Greater Vancouver real estate boards.
I expect to see continued strength in sales numbers combined with modest price changes (likely negative in the FV and positive in GV). The summer slowdown is happening and further weakness in sales will bring about more rapid negative price changes as we head into the fall.
VHB has done a linear projection of sales and inventory data for the rest of the year which, if it comes to pass, would definitely put the market into negative price changes.
What do you think we will see? What will the rest of the summer bring? Fall?
I expect to see continued strength in sales numbers combined with modest price changes (likely negative in the FV and positive in GV). The summer slowdown is happening and further weakness in sales will bring about more rapid negative price changes as we head into the fall.
VHB has done a linear projection of sales and inventory data for the rest of the year which, if it comes to pass, would definitely put the market into negative price changes.
What do you think we will see? What will the rest of the summer bring? Fall?
Subscribe to:
Posts (Atom)