Thursday, July 29, 2010

How Real Estate Investors Invest Part 2

In the previous post in this series I outlined the basic inputs and calculations used by certain investors when determining the investment value of a particular property. In this installment we go through a simple example for a purpose-built rental building. A massive thanks to Rachelle over at Landlord Rescue for allowing me to publish a simple spreadsheet containing the calculations of an actual property in the Toronto area. (Toronto was used instead of Vancouver to avoid investors in Vancouver real estate from soiling themselves.)

link to spreadsheet (Note there is a bug with google spreadsheets; Click refresh if you get an annoying popup window and avoid dragging your mouse over the "anyone with the link" link. Should be fixed soon I hope.)

This is an actual real-life building in the GTA. We have the following inputs:

Purchase Price = $528,800
Closing Costs = $1,000
Deferred Maintenance (Renovations) = $0

Revenue
Rent = 5 units totaling $3725/month

Expenses
Taxes = $4759/yr
Insurance + Utilities* = $4974/yr
Property management** = 8% of revenue
Building maintenance = 10% of revenue
Vacancy allowance = 5% of revenue
TOTAL = $1668/month

* Rent includes utilities
** Property management fees can be a few % higher in Vancouver

Calculations
NOI = Revenue-Expenses = $2057
Cap rate = NOI/Purchase Price = 4.7%
GRM = Purchase Price/Revenue = 11.82 (price/monthly rent = 142)

Financing
Here the investor is putting 30% down and assuming a 5% mortgage interest rate. With these numbers the mortgage payments just cover the NOI and is cash flow neutral, which is the goal of this particular investor.

Discussion
Here we see the investor requires 30% down and 5% mortgage rate to make this property cash flow neutral. Also note the investor does not consider capital appreciation when determining the investment's value; it's all about the cash flow at what they consider to be a sustainable financing rate.

We can see right away the impact of lower mortgage rates on these investors' criteria for a cash flow positive property. They have no earnings, at least initially, save debt repayments. In time, the investor assumes, the rents will increase with inflation and start producing positive cash flow.

After some years there will be some added expenses as the building starts aging. This is partly, but not completely, accounted for in the 10% gross rent maintenance allowance. Significant overhauls may be necessary from time to time and this is accounted for through depreciation allowances, usually a few % of the purchase price on a geometric schedule. Though the spreadsheet does not explicitly cover this, one can expect in time some of the free cash flow to be diverted to capital replacement.

Also for consideration is the 5% assumed mortgage rate. Certainly in today's climate mortgage rates could easily stay at or below this level for some time. I have no doubt some investors are using even lower rates (even variable rates!) when calculating their monthly cash flow. Food for thought, though, that rates this low are borderline deflationary. It is unclear if the projected rental increases will be as large as anticipated if rates remain low.

With this in mind, there is a box at the bottom of the spreadsheet for calculating purchase price for a given cap rate. That is (at least in theory), an investment with revenues that generally track inflation should not vary their present value when inflation changes, therefore the cap rate will stay constant. What cap rate would be considered acceptable? Well the "acceptable" number used by this investor is 7% for that particular property, putting an acceptable purchase price in the area of $308,600. Food for thought.

So there you have it. A real-life example of a cursory analysis of a potential real estate investment. Certainly there is a ton more to consider when evaluating a particular property's investment viability but, following this investor's philosophy for what it's worth, having these numbers work on a particular property (at whatever values one considers acceptable) should warrant some additional investigation. Otherwise, it's probably best to spend one's efforts elsewhere.

Wednesday, July 28, 2010

Teranet House Price Index - May 2010

NEWSLETTER - JULY 28, 2010

Click here to view the BlackBerry format
Click here to launch the newsletter in your browser
Cliquez ici pour la version française
House Price Index

Monthly Report

JULY 2010

Monthly price rise of 1.3% in May

Canadian home prices in May were up 13.6% from a year earlier, according to the Teranet-National Bank National Composite House Price Index™. The 12-month gain was strongly influenced by Vancouver, up 17.1%, and Toronto, up 16.0%. In the other four markets surveyed, the 12-month rise ranged from 5.6% in Halifax to 11.4% in Ottawa. In Calgary it was 7.8% and in Montreal 8.5%.

May was the second consecutive month in which prices were up from the month before in all six metropolitan areas surveyed. The monthly rise of the composite index, 1.3%, was the largest since last September. The monthly rise was 2.3% in Ottawa, 1.8% in Montreal (the largest gain in this market since June 2007), 1.2% in Vancouver and Calgary, 1.1% in Toronto and 0.7% in Halifax.

Teranet – National Bank National Composite House Price Index™

Contact Us

For general enquiries:

info@housepriceindex.ca

For licenses covering all index-linked products, please contact:

Simon Côté
514 879-5379

Since market conditions have been loosening across Canada - from April to June of this year, the number of existing homes sold declined much faster than the number of new listings - it is too early to conclude that the relatively vigorous prices rises of April and May mark the beginning of a trend. The prospect of harmonized sales taxes coming into effect July 1 in Ontario and B.C. may have had the effect of pushing up sales in Vancouver, Toronto and Ottawa in the preceding months.

Teranet – National Bank House Price Index™

The historical data of the Teranet – National Bank House Price Index™ is available at www.housepriceindex.ca.

Metropolitan areaIndex level
May 2010
% change m/m% change y/y
Calgary160.211.2 %7.8 %
Halifax128.160.7 %5.6 %
Montreal133.021.8 %8.5 %
Ottawa126.222.3 %11.4 %
Toronto123.031.1 %16.0 %
Vancouver155.231.2 %17.1 %
National Composite136.321.3 %13.6 %

The Teranet–National Bank House Price Index™ is estimated by tracking observed or registered home prices over time using data collected from public land registries. All dwellings that have been sold at least twice are considered in the calculation of the index. This is known as the repeat sales method; a complete description of the method is given at www.housepriceindex.ca

The Teranet–National Bank House Price Index™ is an independently developed representation of average home price changes in six metropolitan areas: Ottawa, Toronto, Calgary, Vancouver, Montreal and Halifax. The national composite index is the weighted average of the six metropolitan areas. The weights are based on aggregate value of dwellings as retrieved from the 2006 Statistics Canada Census. According to that census1, the aggregate value of occupied dwellings in the metropolitan areas covered by the indices was $1.168 trillion, or 53% of the Canadian aggregate value of $2.207 trillion.

All indices have a base value of 100 in June 2005. For example, an index value of 130 means that home prices have increased 30% since June 2005.

By:

Marc Pinsonneault
Senior Economist
Economy & Strategy
National Bank Financial Group

Monday, July 26, 2010

Metro Vancouver Rental and Ownership Data

A great summary of the ownership, rental, and affordability state of the union for Metro Vancouver can be found over at metrovancouver.org.


In the latter link there is a presentation entitled Metro Vancouver Housing Data Book (PDF) that contains some wonderful demographic and affordability data that make authors of a housing analysis blog drool. A few key points made in this presentation:

  • The median owner income of $69,318 is equal to approximately 125% of the median household income for the region.
  • Based on the median income of $69,318, an “affordable housing cost” is equal to $1,733 per month using the standard that housing should not cost more than 30% of a household's gross annual income.
  • In 2006, there were 817,230 households in Metro Vancouver; 531,725 (65%) were owners and 285,045 (35%) were renters.
  • 21% (59,275) of renter households had annual incomes above $45,000. This fits the general definition of moderate and above income (above 80% of the regional median income). Of these households, 11% (31,220) had incomes between $70,000-$100,000, and 7% (19,975) had incomes above $100,000.
  • Region wide, 39% (314,780) of all households had an annual income of $70,000 or above, of which 84% (262,035) were home owners and 16% (51,195) were renters. 20% (106,030) of owner households had annual incomes between $70,000-$100,000, and 29% (156,000) had incomes above $100,000.
  • Of the 285,045 renter households in 2006, approximately 37% were accommodated in the 104,952 purpose-built apartment rental units counted by CMHC. The remaining rental stock is predominately non-market rentals, private condominium rentals, and rented single detached and other ground-oriented units
  • The Statistics Canada Censuses shows that between 1991 and 2006 the total number of households increased from 609,380 to 817,035. For this period, as a percentage of the total housing inventory, apartment households increased from 34% (208,225) to 40% (321,970), while single detached households declined from 50% (302,120) to 35% (288,320).
  • Data reported from CMHC shows that for Metro Vancouver for the period from 1999 to 2008 (10 years), average apartment rents increased from $725 to $937, an increase of 31% or 2.7% per year.
  • During this same 10 year period for Metro Vancouver, according to the BC Stats Consumer Price Index, general prices increased by 20% or 1.8% per year on average.
  • During this same 10 year period for British Columbia, according to BC Stats, average wages increased by 24% or 2.2% per year on average.
  • Overall for the period, the average wage increase was greater than the general price increase, but lower than the average apartment rent increase.
  • Metro Vancouver estimates that there are 69,200 - 75,500 secondary suites in the region. This represents approximately 22% to 24% of the total rental households (318,000) in 2009. [jesse: note the secondary suite accounting is all over the map. It is in many ways the proverbial "dark matter" of the city's housing market.]
  • The average rent for a one bedroom secondary suite was $730, 20% ($189) less than the average rent in a conventional apartment building. The average rent for a two bedroom secondary suite was $862, 26% ($307) less than the average rent in a conventional apartment building.
There are much more data in the presentation. Well worth a read if you're trying to wrap your head around Metro Vancouver's housing market.

Wednesday, July 21, 2010

Bank of Canada Paper on Housing Stock

TitleA Model of Housing Stock for Canada
AuthorDavid Dupuis and Yi Zheng
TypeWorking Paper 2010-19
Date of
publication
July 2010
LanguageEnglish
AbstractUsing an error-correction model (ECM) framework, the authors attempt to quantify the degree of disequilibrium in Canadian housing stock over the period 1961–2008 for the national aggregate and over 1981–2008 for the provinces. They find that, based on quarterly data, the level of housing stock in the long run is associated with population, real per capita disposable income, and real house prices. Population growth (net migration, particularly for the western provinces) is also an important determinant of the short-run dynamics of housing stock, after controlling for serial correlation in the dependent variable. Real mortgage rates, consumer confidence, and a number of other variables identified in the literature are found to play a small role in the short run. The authors’ model suggests that the Canadian housing stock was 2 per cent above its equilibrium level at the end of 2008. There was likely overbuilding, to varying degrees, in Saskatchewan, New Brunswick, British Columbia, Ontario, and Quebec.
Bank
topic index
Domestic demand and components
JEL
classification
E21, J00

You may download the paper in the following format(s):

Friday, July 16, 2010

How Real Estate Investors Invest

This blog often deals with subjects that border on the abstract when it comes to the nuts and bolts of real estate investing. I recently viewed a spreadsheet used by a full-time real estate investor, one also used by many of this investor's acquaintances in the same line of work. This post is devoted to me explaining what factors they are using in their spreadsheet to calculate returns.

I will be focusing on a spreadsheet for the so-called "buy and hold" strategy -- buy, rent out, and hold indefinitely. We do not assume the property will be sold any time soon but, of course, capital appreciation comes in to calculating total return. So lets get into it.

(Note, I do not have permission to share this spreadsheet directly, however I will summarise how its calculations are performed as well as what inputs are used.)

Purchase Price

The first input into the spreadsheet is purchase price. We add into this closing costs and taxes, as well as any renovations that need to be performed before occupancy:

Total Price = Purchase Price + Closing Costs + Renovations

Revenue (Rent)

The major source of revenue for a property is rent. Here we use the anticipated annual rent from the property. There may be additional income sources, including: parking, vending, storage, interest income (e.g. on capital reserve), laundry, et cetera.

Operating Expenses

Operating expenses are the ongoing costs of maintaining the property. These would include property taxes, insurance, vacancy loss, advertising, repairs, management, strata fees, etc.

A big operating expense that is often overlooked by much of the analysis I see online is the so-called "capital cost allowance" which is effectively building up a reserve for capital replacement. This is, in the extreme, building up a reserve for building replacement but also includes large or small renovations that inevitably occur as the building ages.

Calculations

After determining our purchase price and costs, revenues, and operating expenses, we can calculate a few common values used by investors to determine their return. These are listed below:

Net Operating Income (NOI) = Revenue - Operating Expenses
Cap Rate = NOI/(Purchase Price) *
Gross Rent Multiiple (GRM) = (Purchase Price)/Revenue

* Note one can substitute Purchase Price with Total Price.

None of these calculations take into account financing. They are straight calculations on the investment's operations. They are also based on current, not future, operations; rent or operating expense increases are not calculated. GRM is analogous to the "price to rent ratio" that local commenters like to refer to. (A price to monthly rent ratio R would be equal to GRM*12.)

Debt Service and Financing

Financing is simply where the money to purchase the property comes from. It is either from the investor directly or through borrowing from a lending institution. Total debt servicing is an expense. Debt servicing costs are highly dependent on the interest rate. For longer term calculations, this interest rate may need to be modified to account for higher or lower rolled over financing costs.

Closing costs is the amount of cash required to complete the purchase, equal to Total Cost - Debt. A typical amount for closing costs would be, say, 25% of Total Cost, though other ratios are of course possible.

Capital Appreciation

Like most property, there will be some capital appreciation, usually expressed as an expected average percentage gain year-over-year.

Calculations after Financing and Appreciation

In a nutshell, a total return is comprised of: cash generation, debt repayment, and appreciation. After 1 year:

Cash on Cash Return (COC) = NOI/(Closing Costs)
Equity = (Purchase Price)*(1+Appreciation) + Cash - Debt
Return on Equity (ROE) = NOI/(Equity)
Total Return on Investment = Equity/Closing Costs - 1

NOI is annualised.

Stuff Not Done

As mentioned, there are things that are not calculated. Rental and expense increases, as well as debt repayment schedules are not calculated. There is a good reasons for this, in this particular case. The philosophy is that if the return after the first year is not positive, it generates no income for the investor. This is not sustainable without a large pool of cash to finance the shortfall -- these particular investors want to produce income.

Summary

Above are some of the formulas used by full-time residential property investors to calculate an investment's return. You can plug any property you see for sale on the market into these formulas into and come up with some typical figures, then play around with the financing costs and appreciation (both these have high sensitivity when it comes to calculating return). I'll go through a simple example next time.

These investors own property locally and are actively looking to invest in property in the current market. If you want to know who is looking to buy, it helps to understand what calculations and analysis they perform to determine a property's value and under what conditions they would buy.

Tuesday, July 13, 2010

Effect of interest rates on affordability under new CMHC rules

Since April 19th, CMHC insured mortgages must qualify under the posted 5-year mortgage rate.

Here is the evolution of the five year posted rate and the five year bond yield over the past two years.
Notice that the yield has dropped around 3/4 of a point since April, but the mortgage rate has not. I guess the banks haven't passed on their savings--so far anyway.

The 5-year posted rate has changed a bit over the three months since the BIG April 19th CMHC rule change. From 6.1% we have moved down to 5.79%. What impact does that have on the maximum people can pay?

Assume the following. 100K of income. 35 year amortization. 40% total debt service ratio, here interpreted as you can pay 40% of your gross income for your mortgage. 5% down.

With these assumptions at a 6.1% qual rate, you can afford to pay $614,666, comprised of $583,933 borrowed and $30,733 downpayment.

As we have moved from 6.1% to 5.79%, what has been the impact on the amount you can pay, given the above assumptions? See the graph below.

I've put it as an index in the axis, so that percentage change is easier to calculate. I also labeled the first and last points with the dollar value. The ability to pay has gone up by 3.6 percent from April 19th to now.

This graph isn't too exciting yet--but with big swings in the mortgage rate, either up or down, this could be a fun one to look at again in the future.

Monday, July 05, 2010

REBGV Statistics - June 2010

The Real Estate Board of Greater Vancouver released the monthly statistics package for the month of June 2010. Active listings held firm at relatively high levels. Sales were not strong for various reasons. Months of inventory rose to just about 6. Prices have fallen for 2 months now. The market looks very weak and set to weaken further with sales falling in the normal seasonal pattern and active listings remaining high.


Fraser Valley Real Estate - June 2010

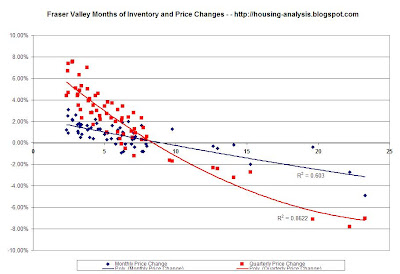
The Fraser Valley Real Estate Board has released their monthly statistics package for June 2010. Active Listings fell and Sales grew during June compared to May. Months of Inventory fell and prices rose very slightly.


Monthly Stats

I expect that today or tomorrow will bring about the monthly release of statistics from the Fraser Valley and Greater Vancouver real estate boards.

I expect to see continued strength in sales numbers combined with modest price changes (likely negative in the FV and positive in GV). The summer slowdown is happening and further weakness in sales will bring about more rapid negative price changes as we head into the fall.

VHB has done a linear projection of sales and inventory data for the rest of the year which, if it comes to pass, would definitely put the market into negative price changes.

What do you think we will see? What will the rest of the summer bring? Fall?