Wednesday, August 29, 2012

City of Vancouver Permit Update for June 2012


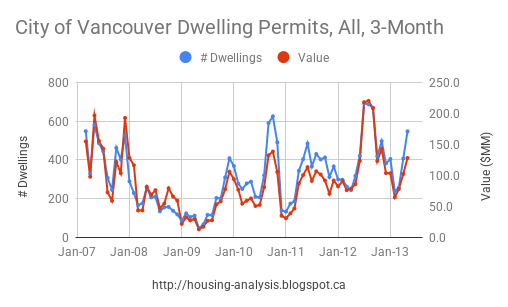
I have been producing some graphs starting in early 2009 showing the trend of permits in the City of Vancouver (here and here and here and here). Here is an update to June 2012.

Residential dwelling permits graphed since 2007:
Permits parsed for 1-2 dwelling units only (i.e. single family, single family with suite, and duplex):
Multi-unit building permits:
All permits' value, residential and commercial:
Value per permit, multi and 1+2:
Demolitions:
Analysis:

  1. The value per permit for detached has almost doubled since 2008. It is unclear why this is occurring, but is likely a combination of higher-end properties being built. If laneway houses are included in the value per permit this would contribute to a higher value per permit. I am unsure if this is the case. Multi-unit value has also crept up meaning the way by which permit value is accounted may have changed.
  2. Demolitions are approaching recent highs again.
  3. Dropping land values destroy detached building activity.
  4. Tightened credit conditions in 2008 are evident in the multiunit permit applications. This is not occurring in 2012.

There seems to be no slowdown in construction activity for the next while.


Edit: Below are 12 month moving average 1+2 dwelling permits plotted with the Teranet HPI. There is a 6 month shift in permit data due to the 12 month averaging filter; if one accounts for that the correlation is 0.95. Something to think about.
(Note: graph not started from zero to highlight correlation)


Saturday, August 25, 2012

Teranet House Price Index and Inventory

Long-time Vancouver real estate blog readers will remember the work mohican did regarding scatter plotting months of inventory (MOI, defined as month-end for-sale inventory divided by sales of that month) with price changes. Price changes have been based on the REBGV detached benchmark, alas the benchmark was revised and historical data are not available. Nonetheless the ever-resilient Vancouver Housing Blogger (VHB) has attempted to stitch together a longer-term MLS HPI and the results can be seen here.

After a bit of refinement it's been possible to improve the price-change-to-MOI fit by looking at price changes over different periods and leading or lagging the datasets. Using Teranet, not MLS-HPI data, I have found the best fit to be as follows:
The best fit is looking at 6 month price changes, delayed by 3 months, and plotting against 3 month moving-average of REBGV months of inventory (MOI). I have plotted above on semilog only to show the effect has a geometric component. Nonetheless a linear correlation is about -0.9, or in statistical lexicon, not bad.

I would take away the following things from this graph, (and I will have much more over the coming months as monthly data become available):

  • Teranet data lags months of inventory. This is for a few reasons, first that Teranet uses data based on closed transactions where MLS uses data timed on subject removals, which can be several months in advance of the closing date. Second Teranet uses some averaging to produce a more statistically significant dataset but results in a lag in reporting the data.
  • Price changes have a seasonal component. Prices are usually firmer in the spring and weaker in the fall and this is part of the reason why 6 month price change correlations protrude from the data field.
  • Most intriguing, and astute readers will have already figured this out, is that there is a strong predictor of the expected Teranet HPI several months in advance of it being reported, based solely on 3 month moving average MOI data.
  • We have a strong indication of MOI about halfway through a month. That is, we need not wait for the REBGV reported month-end data -- with daily numbers being reported by Paul Boenisch and Larry Yatkowski we get a sneak-peak at the likely MOI value. Also check the comment section of vancouvercondo.info for some more analytical predictions of month-end inventory and sales.
  • This graph validates that an MOI above 7 means prices are going to drop. Current MOI is approaching 10.
I'll have some more fun graphs in the months ahead.

Tuesday, August 14, 2012

BC Employment by Sector July 2012


Below are some graphs highlighting BC's employment over the past 15 years in various sectors. But first here are the historical employment, participation, and unemployment rates (CANSIM table 282-0117)


Here are the contributions of the two major goods producing sectors (construction and manufacturing) as a percentage of total employment. These are seasonally unadjusted with 3 month moving average applied (CANSIM table 282-0111).
And the service producing sectors.

Commentary:
A rebound of manufacturing sector employment can indicate some degree of job reclassification rather than a sectoral shift in employment. Construction employment is still high relative to its historical limits of the past 15 years and remains a larger part of BC's workforce than previous. If construction were to stumble closer to levels seen earlier in the century, there is some hope that manufacturing can fill at least some of the gap, though if construction job flux is simply being reclassified as manufacturing and does not represent a secular rotation, BC's dependency on construction employment is not abating and remains an elevated risk to future economic growth.

Nonetheless, it appears on balance that BC's economy has continued to recover alongside the rest of North America.

Friday, August 10, 2012

Vancouver CMA Rent Analysis

An important part of the housing market is the rental stock, most closely surveyed by CMHC from a universe of just over 100,000 units from buildings containing 3 or more units (CANSIM table 027-0040, using rental survey data taken every October). This dataset is interesting to track because its pool has been relatively unperturbed by new dwellings: most of the rental stock tracked by CMHC is of older vintage. This provides a way of tracking same-unit rental growth over time, something that individual investors would be most concerned about and provides a method to directly compare same-unit price trends to their yields, at least on a relative basis, something that can become muddied with the change of vintage of a survey's data sources. I have pulled the data to look at how rents have changed in Vancouver CMA for this "baseline" rental pool and have normalized them based on 2002 CPI-adjusted prices.

We can see that real rents have been appreciating between 0.75% and 1.25% per year. Note that from between 2006 and 2010 population growth was on the high end of historical ranges and this is correlated with tightness in the rental market.

Looking at the rent to median income ratio:
Median incomes have fluctuated more than rents, causing the ratios to be more variable. After 2008 it can be immediately seen that as a percentage of income rents are now more dear.

An interesting graph is tracking dwelling spreads -- the percentage change between a dwelling type and the dwelling type with one additional bedroom:
What this graph shows is a "curve" for the spread between different dwelling types, in some ways akin to a bond yield curve. A diminishing spread would indicate compression between dwelling types.

There had been some thought that real rents have not been increasing. These data indicate that real rents are increasing at a rate around 1% per year, with more marked changes happening recently from 2006 through 2009. In terms of incomes there is additional fluctuation due to labour market changes, however it appears that rents are over longer time periods tracking incomes closely, though 2011 has produced tighter conditions.

Changes in population growth appear to be having an effect on rental rates. It is unclear recent tightness in the rental market is a permanent change -- for example, rents are increasing because the city is comparably more desirable for a given income -- or if we should expect relative weakness in rental growth going forward. The most recent rental survey from April 2012 indicates no strong signs of weakness.

Thursday, August 09, 2012

Unabsorbed Detached Units in Vancouver CMA

An anomaly has presented itself in some CMHC data regarding matching the completed, absorbed, and unabsorbed datasets available through Statscan's CANSIM tables. First a bit of background on the data I'm using:

  • "Completed" is the number of units that have been registered as being completed in a given month.
  • A unit is "absorbed” is when a binding, non-conditional agreement is made to buy or rent the dwelling.
  • "Unabsorbed inventory" is the total number of units that have not been absorbed.
  • "Completed but unabsorbed" is the number of units that completed but were not absorbed in a given month.
"Unabsorbed inventory" (U) is theoretically derived from "completed" (C) and "absorbed" (A) as follows (where i is a given month and i-i is the previous month):
U[i] = U[i-1]+C[i]-A[i]

So taking the reported unabsorbed inventory and reconstructing it using completed and absorbed data should produce a match. CANSIM data are only available for single and semi detached properties so these are the data I have used. Alas they don't seem to track very well in absolute terms:
The reason for the divergence is unclear but a much more interesting thing arises upon visual inspection: the higher-frequency terms appear to track each other closely. To isolate this effect I added a first order highpass filter with 6 month time constant and yield the following result:
Indeed for most of the series over the past 24 years the higher frequency terms are similar, except in the past 18 months or so where the reported absorbed inventory has fallen markedly short of reported completions, but this is not showing up in the reported unabsosrbed inventory.

I'll leave it for CMHC to figure out what's going on before making any speculations, but for those tracking unabsorbed inventory when looking for potential distress in housing markets, this should be something that should be resolved. If I can find the multi-unit absorbed/unabsorbed datasets I'll add to the analysis to see if this effect carries over. (Multi-unit is a much more significant component of Vancouver CMA's construction activity; detached is about 25% in terms of dwelling completions in the past few years.)