I have been producing some graphs starting in early 2009 showing the trend of permits in the City of Vancouver (here and here and here and here). Here is an update to June 2012.
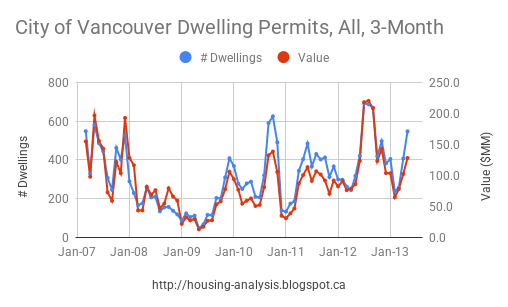
Residential dwelling permits graphed since 2007:
 Multi-unit building permits:
Permits parsed for 1-2 dwelling units only (i.e. single family, single family with suite, and duplex):
Value per permit, multi and 1+2:
Analysis:
- The value per permit for detached has almost doubled since 2008. It is unclear why this is occurring, but is likely a combination of higher-end properties being built. If laneway houses are included in the value per permit this would contribute to a higher value per permit. I am unsure if this is the case. Multi-unit value has also crept up meaning the way by which permit value is accounted may have changed.
- Demolitions are approaching recent highs again.
- Dropping land values destroy detached building activity.
- Tightened credit conditions in 2008 are evident in the multiunit permit applications. This is not occurring in 2012.
There seems to be no slowdown in construction activity for the next while.
Edit: Below are 12 month moving average 1+2 dwelling permits plotted with the Teranet HPI. There is a 6 month shift in permit data due to the 12 month averaging filter; if one accounts for that the correlation is 0.95. Something to think about.
(Note: graph not started from zero to highlight correlation)
No comments:
Post a Comment