| ||||||||||||||||||||||||||||||||||||||||||||||||||||||||||
The composite index was down 0.4% from November, the fourth consecutive monthly decline, a first out of a recession, and the fourth December monthly decline in 13 years of data, including December 2008 when the country was in recession. Prices were down from the month before in eight of the 11 markets surveyed. For Montreal (−0.3%) and Ottawa-Gatineau (−0.1%) it was the fourth straight monthly decline. For Halifax (−0.7%), Winnipeg (-0.7%) and Toronto (−0.3%) it was the third. For Edmonton (−0.1%) it was the third in fourth months, for Vancouver (-1.0%) the fifth in six months, for Calgary (−0.9%) the second in three months. Prices were up 1.7% on the month in Quebec City, ending a run of four monthly declines, and 0.9% in Hamilton and Victoria. The monthly gain in Victoria followed four straight months of retreat.Teranet – National Bank House Price Index™  The historical data of the Teranet – National Bank House Price Index™ is available at www.housepriceindex.ca.
The Teranet–National Bank House Price Index™ is an independently developed representation of average home price changes in six metropolitan areas: Ottawa, Toronto, Calgary, Vancouver, Montreal and Halifax. The national composite index is the weighted average of the six metropolitan areas. The weights are based on aggregate value of dwellings as retrieved from the 2006 Statistics Canada Census. According to that census1, the aggregate value of occupied dwellings in the metropolitan areas covered by the indices was $1.168 trillion, or 53% of the Canadian aggregate value of $2.207 trillion. All indices have a base value of 100 in June 2005. For example, an index value of 130 means that home prices have increased 30% since June 2005.
1 Value of Dwelling for the Owner-occupied Non-farm, Non-reserve Private Dwellings of Canada.
|
Saturday, January 26, 2013
Teranet House Price Index December 2012

Monday, January 21, 2013
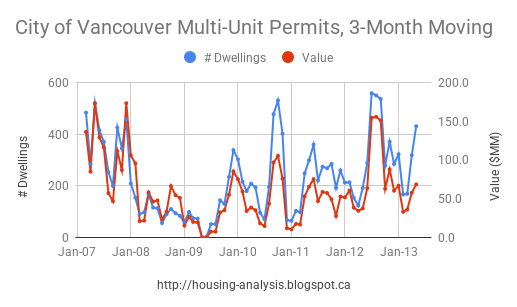
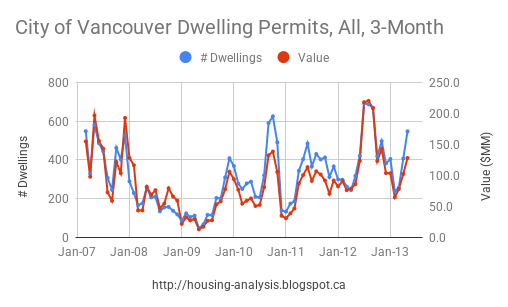
City of Vancouver Permit Update for November 2012
I have been producing some graphs starting in early 2009 showing the trend of permits in the City of Vancouver. Here is an update to November 2012.
 All permits' value, residential and commercial:


 Demolitions:
 There seems to be no slowdown in construction activity for the next while.
Below are 12 month moving average 1+2 dwelling permits plotted with the Teranet HPI. There is a 6 month shift in permit data due to the 12 month averaging filter; if one accounts for that the correlation is 0.95. Something to think about.

Residential dwelling permits graphed since 2007:
 Multi-unit building permits:
Permits parsed for 1-2 dwelling units only (i.e. single family, single family with suite, and duplex):
Value per permit, multi and 1+2:
Below are 12 month moving average 1+2 dwelling permits plotted with the Teranet HPI. There is a 6 month shift in permit data due to the 12 month averaging filter; if one accounts for that the correlation is 0.95. Something to think about.
(Note: graph not started from zero to highlight correlation)
Wednesday, January 16, 2013
Under Construction and Population Growth
I have highlighted declining population growth (second derivative of population) as a bearish indicator for real estate in the short term however provincial population growth does not exemplify intraprovincial growth differences and how construction activity is related. To highlight this relationship I have graphed under construction in major BC centres and have similarly graphed annualized population growth in these centres


The points of interest are the most recent population growth statistics and how they align with population growth differentials in other provincial centres. As under construction activity for a city increases, population growth in that city will tend to be more robust than other cities in the province with lacklustre construction activity.
Recently Vancouver under construction has been trending higher. It looks to be peaking in the next few quarters unless housing starts continue to increase. If housing starts decrease we can expect under construction to decrease. That will have implications for population growth into the Vancouver area in the coming year.
Note also how far population growth fell in the early 2000s. 2012 real estate activity in Vancouver was on the weak side already even with population growth not too far off its highs of the last decade. There was an uptick in population growth in 2012. All else equal this would lead to more robust real estate activity in 2013 than in 2012.
Another interesting chart is overlaying population growth and housing starts and completions. Using data extending back to 1980 there is a relationship between housing starts and completions and population growth (graphs not set set to zero to show correlation):
The relationship showing completions lagging starts is evident, less certain is a causal relationship between population growth and housing construction. Some clues can be garnered by cross-correlating on the time scale pre-2000 and since the turn of the century:
The correlation seems strongest, in the two decades preceding the 2000s, when completions are lagged by 2 quarters relative to population growth. More recently completions are leading population growth. This may well be noise however it may also be an increasing dependence on construction activity is leading to different population growth dynamics than in previous decades.
The key takeaways I garner from this analysis are that under construction activity is related to population growth. If under construction activity subsides again due to a combination of falling starts and rising completions (as I expect) this will have further negative implications for real-estate-related activity in Vancouver.
Wednesday, January 09, 2013
November 2012 CMHC Data - Vancouver CMA
Here is the chart for housing starts, completions, and under construction for Vancouver Census Metropolitan Area (CMA) to November 2012 with December 2012 preliminary housing starts:

 The last three years have seen an increasing amount of starts and under construction volume, the former of which now looks to have crested. Completions are trending upwards, as expected -- completions typically lag starts, so if starts are trending higher that will likely mean completions will trend higher as well. 12 months of completions are now 30% above the trough in 2011. (The actual trough was in early 2011.) With this increased level of completions, and what looks like either a plateaued or further-increasing level of completions into next year, we can expect increased competition among sellers in 2013 compared to 2012.

Below we can see a continued high level of multi-unit construction compared to detached construction. The long-term trend for detached construction is down.
On the unit absorption front here is completed and unabsorbed for single and semi detached dwellings. When I track down the dataset for multi I'll put together a graph on it. There is an enigma in some of my data, indicating that unabsorbed inventory may be under-reported. I'll have more on this in the coming weeks.
Monday, January 07, 2013
Fun With Predictors
Here is a fun predictor I use to guess near-term (i.e. 4-6 months out) price movements on the Teranet HPI. The model works by finding peak correlation between price changes and months-of-inventory, the best is shown below:

I then use a simple regression fit (I'm ignoring log fit for now) and play around with the regression window length and get minimized error post-2009 with an 8-month window. Since peak cross correlation is shifted we have the ability to "predict" price changes some time into the future, in this case 3 months ahead:


This is then translated onto a year-on-year prediction:
On the graph above I get an estimate of close to -5.5% YOY change in the March Teranet HPI. I have been calling for between -6% and -4% on the Teranet HPI in February-March of 2013.
Friday, January 04, 2013
BC Employment by Sector December 2012
Below are some graphs highlighting Vancouver's and BC's employment over the past 15 years in various sectors. But first here are the historical employment, participation, and unemployment rates (CANSIM tables 282-0117 and 282-0087)
And the spreads between the rest of BC and Vancouver CMA. A positive number means the rest of the province has a higher number than Vancouver. A sharp 1% downtick in Vancouver CMA unemployment has shot the unemployment spread back above zero.
And the service producing sectors (NSA)
The red line on the service sector graph, "Finance, insurance, real estate and leasing [52-53]", has dropped down as it did in 2008. Transportation and warehousing is showing a marked rebound as % employment. Strength in manufacturing has waned of late and its movements have been coupled tightly with construction employment. The sudden downtick in the unemployment rate is good news, if it sticks.
Thursday, January 03, 2013
Greater Vancouver Market Snapshot December 2012
Below are updated sales, inventory and months of inventory graphs for Greater Vancouver to December 2012. (see REBGV news releases.). (My "next month estimate" numbers are what I think next month will be. Also note these graphs update automatically so older blog posts from previous months will show the same graphs as the ones below.)
The scatterplot of price changes and months of inventory is below. As the Teranet data roll in, look for more points appearing the right-hand side.
Commentary:
December continued with relative weakness compared to not only 2011 but also past years from 2005 (except the residual emerging from the recession of 2008-2009). December sales are near lows in at least the past decade, though above levels seen in 2008.
To partially compensate for weekend framing effects I have plotted sales per working day on a month-by-month basis.

This December saw another weak report. Sales for the year are bad and this has direct effects on incomes of those who depend on resale turnover for income. Total sales for 2012 are about the same as 2008, albeit average sales price for 2012 is likely higher. I would not be surprised to see the Teranet HPI down between -6% and -4% year-on-year by February or March of 2013.

As a recurring reminder, there are some worrying clouds on the horizon: population growth is falling, dwelling completions are set to increase over the next year if not longer, and banks have implemented stricter mortgage guidelines via changes to government-underwritten mortgage insurance qualification criteria and via implementation of stricter mortgage lending guidelines under OSFI's new directives. (Credit Unions are one notable exception though it appears BC CUs will comply with the brunt of OSFI guidelines.) Further stress in current conditions can be attributed to China's slower economic growth, though it looks like growth is set to resume some entering 2013; for how long this growth can continue is uncertain.
On the other hand mortgage rates remain low, near net zero real territory, and it is possible for rates to remain low for a prolonged period (i.e. several years). That stated, longer-term 5-year-term loan rates may have some room to move up in the coming year as the advent of the removal of accommodative overnight rates starts entering the purview of the 5 year time horizon.
Asian economies are currently meting out another round of investment spending through coordinated government stimulus measures -- and not only in Asia but also in other jurisdictions -- and that can plausibly lead to a renewed, but in my view temporary, bout of current account flows into Vancouver-area property investments. Investment trends in China are difficult to ascertain; some analysts and academics like Michael Pettis are pointing to some worrying signs in the coming years regarding hard commodity demand and investment growth there. If that analysis proves correct, that would have a direct and negative impact on Vancouver-bound remittances and external residential investment.
Predicting trends in 2013 is the topic du jour. Prices have a seasonal component to them, with price changes robust in the spring and trending towards less robust in the subsequent winter. Prices rarely drop in the spring and if they do it likely means prices in the latter half of the year will be weaker than even 2012. If 2013 is going to be a bad year -- worse than 2012 -- the key I would be looking for is consistent listings growth through March. If that occurs, given the bearish tilt on the factors I mentioned above, I would not hold up much hope of Vancouver prices remaining flat for the duration of the year.
To partially compensate for weekend framing effects I have plotted sales per working day on a month-by-month basis.
This December saw another weak report. Sales for the year are bad and this has direct effects on incomes of those who depend on resale turnover for income. Total sales for 2012 are about the same as 2008, albeit average sales price for 2012 is likely higher. I would not be surprised to see the Teranet HPI down between -6% and -4% year-on-year by February or March of 2013.
On the other hand mortgage rates remain low, near net zero real territory, and it is possible for rates to remain low for a prolonged period (i.e. several years). That stated, longer-term 5-year-term loan rates may have some room to move up in the coming year as the advent of the removal of accommodative overnight rates starts entering the purview of the 5 year time horizon.
Asian economies are currently meting out another round of investment spending through coordinated government stimulus measures -- and not only in Asia but also in other jurisdictions -- and that can plausibly lead to a renewed, but in my view temporary, bout of current account flows into Vancouver-area property investments. Investment trends in China are difficult to ascertain; some analysts and academics like Michael Pettis are pointing to some worrying signs in the coming years regarding hard commodity demand and investment growth there. If that analysis proves correct, that would have a direct and negative impact on Vancouver-bound remittances and external residential investment.
Predicting trends in 2013 is the topic du jour. Prices have a seasonal component to them, with price changes robust in the spring and trending towards less robust in the subsequent winter. Prices rarely drop in the spring and if they do it likely means prices in the latter half of the year will be weaker than even 2012. If 2013 is going to be a bad year -- worse than 2012 -- the key I would be looking for is consistent listings growth through March. If that occurs, given the bearish tilt on the factors I mentioned above, I would not hold up much hope of Vancouver prices remaining flat for the duration of the year.
Subscribe to:
Posts (Atom)