Wednesday, December 03, 2014

An In-depth Look at the Canadian Housing Market

by Tom Bradley, Steadyhand Investment Funds
In the last couple of weeks, there has been two excellent reports published on the Canadian housing market – one by the Canada Mortgage and Housing Corporation (CMHC) and the other by RBC Global Asset Management. Both are good reads for people who want to dig into the detail and get a better understanding of the many factors that drive housing prices and activity.
Both reports draw conclusions that are consistent with what the real estate industry and banks are saying – there are some signs of strain in the market, but the risks are more benign than what the doomsayers like me are suggesting.
CMHC’s fourth quarter assessment provides an overview of where we are today (price trends, sales to listings ratios, unabsorbed inventory levels and vacancy rates on rental units). Overall, the report concludes that the Canadian market is not overbuilt and overheated, and only moderately overpriced.
Despite the conclusion, I find the CMHC report less useful in addressing what lies ahead. It uses some sophisticated modeling to measure current valuation, but the interest rate cycle is not discussed. Given that house prices are highly geared to changes in interest rates, some sensitivity analysis would have been useful.
The RBC report is very thorough and attempts to address all of the doomsayers’ concerns. There are many interesting charts, including the scorecard below:

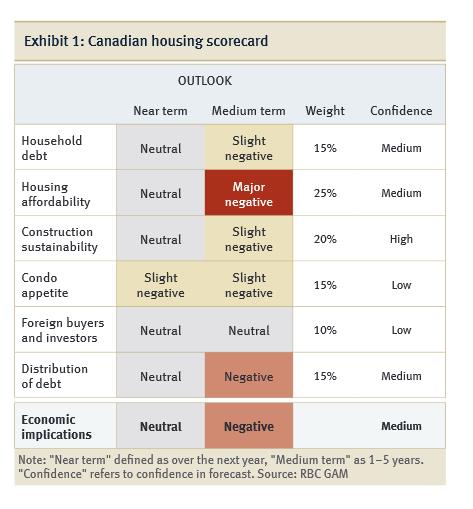
I find the author’s conclusion (Chief Economist Eric Lascelles) to be surprising in light of this scorecard. He says, “Broadly, the near-term outlook appears benign, tilting only slightly in a negative direction.” Yes, the near-term is holding up OK, but there’s nothing benign about his 1-5 year outlook.
I learned a lot from both reports, but they didn’t change my view. There are a number of factors that weren’t discussed or need more emphasis:
  • House prices hinge on mortgage rates that are, by any measure, well below normal levels. Basing the price of an asset on another asset that is overpriced (bonds) is a scary proposition.
  • Pricing and market psychology will not be determined by the 72% of homeowners who have more than 25% equity in their house. Rather, it will be driven by the 5% who have less than 10% equity. The mistake forecasters made in the U.S. a decade ago was taking comfort from the majority instead of being wary of the weak minority.
  • What is bothersome is the number of factors that are in negative territory. It’s possible to explain away one or two ratios that are off trend (which Eric does well), but when there’s a wall of them, it gets to be a stretch.
  • Even the most positive of analysts have trouble pointing to any factors that are highly positive. The best either report can do is ‘neutral’. In my mind, it’s hard to make a case for investment when there are no positive indicators to offset the risks.
  • There’s little recognition in either report of how good the environment has been. These are not normal times. Housing prices have had a howling tailwind at their back – subsidized mortgage rates, abundant credit, a growth spurt in the buying cohort (25-34 year olds), rising home ownership and foreign buying. In a few years, we’ll look back and marvel at how good everything was.
  • And the one I feel most confident about – extreme cycles don’t end with ‘benign’ corrections. It just doesn’t happen.

Copyright © Steadyhand Investment Funds

Tuesday, November 18, 2014

Annual State of the Residential Mortgage Market in Canada - CAAMP


Annual State of the Residential Mortgage Market in Canada

Significant Statistics – November 2014
  • During 2014, 31% of Canadians obtained their mortgage from a mortgage broker, 61% directly from a bank.
  • For mortgage holders who renewed their mortgage in the last 12 months, 78% saw a reduction in their rate.
  • Mortgage discounting remains prevalent across Canada, for a 5-year fixed mortgage the average discount was 1.85%.
  • 69% of all outstanding mortgages are fixed rate, 24% variable and 6% combination. For the past 12 months 76% are fixed rate.
  • In the past year, 38% of mortgage holders either increased their amount of payment, made a lump sum payment or increased their frequency of payments.
  • 85% of all homeowners in Canada have 25% or more equity in their homes.
  • Mortgage credit growth will continue to slow, averaging 4.5% by end of 2015. Mortgage credit growth has averaged 8.1% per year during the past decade.
  • 70% of homeowners see their home as a place to live, 30% see it as an investment.
  • 11% of all homeowners took out equity from their property last year with an average take-out amount of $58,000. Debt consolidation and renovation are the top two areas where money was used.
  • The average mortgage interest rate in Canada is 3.24%.
  • Among homeowners who purchased during 2014, the average mortgage interest rate is 2.89%.

Friday, August 01, 2014

Canadian Real Estate - A Crack in the Tree

by Tom Bradley, Steadyhand Investment Funds

The Full Article

“It’s like if the tree in the backyard has a crack in it, you worry it’s vulnerable to a storm. But if no storm happens, it goes on and on, and maybe eventually strengthens through growth. If the right storm comes along and knocks it onto your neighbour’s house you’ve got a problem.”

This analogy for the Canadian residential real estate market is from our Bank Governor, Stephen Poloz. It prompted me to pull together a number of observations that were building up in my real estate file. In the attached piece (it’s too long for a blog), I point out that:
  • Being too early is tantamount to being wrong.
  • Real estate is a cyclical asset, cycles have a symmetry to them and therefore, extremely good cycles don’t end with a little pause or modest slowdown.
  • There’s a strong consensus that interest rates will stay low and house prices will stay high.
  • Fundamental measures are on balance negative. The most important ones are extremely negative.
  • Foreign buying, inter-generational transfer and the loonie are wild cards in the analysis.
  • Canadians are focused on the ‘Income Statement’ impact of buying a home (i.e. carrying cost), but are overlooking the ‘balance sheet’ impact.
  • We’ve been in an ideal environment for rising real estate prices. It’s been a ‘virtuous circle’. If a few of the variables turn, a downward spiral is equally possible.
  • A few other items that will make real estate bulls mad.
In true Steadyhand fashion, I’m not suggesting you make a big asset shift by selling your home and moving the family into a rental. But I am suggesting that it’s time for added caution. If possible, you should to be subtracting from this asset class, not adding.

Copyright © Steadyhand Investment Funds

Sunday, June 15, 2014

April 2014 Residential Construction Activity - Vancouver CMA

Below are CMHC starts, completions and under construction for Vancouver CMA to April 2014. Starts and completions are displayed as 12 month sums (included May preliminary housing starts):
No signs of a downturn...


Thursday, June 12, 2014

Teranet House Price Index - May 2014

HOME PRICES UP 0.8% IN MAY

In May the Teranet-National Bank National Composite House Price Index™ was up 0.8% from the previous month. This increase, though substantial in itself, was the fifth smallest for May in the 16 years covered by the index. The countrywide composite index rose to an all-time high, but only three of the 11 metropolitan markets surveyed did the same. Prices were up from the previous month in seven markets and by more than the national average in five. The 3.1% monthly gain in Halifax was the largest in the history of that market. Prices rose 2.0% in Hamilton, 1.6% in Quebec City, 1.3% in Toronto, 1.1% in Calgary, 0.6% in Edmonton and 0.5% in Montreal. Calgary's advance was the fourth in a row exceeding 1%, taking prices to a new high. New records were also reached in Hamilton and Toronto. Prices were unchanged from the month before in Ottawa-Gatineau and Vancouver. The reading for Vancouver ended 12 consecutive months of rising prices. Prices were down from the previous month in Victoria (−0.1%) and Winnipeg (−0.3%).

Teranet – National Bank National Composite House Price Index™

Contact Us

For general enquiries:

info@housepriceindex.ca

For licenses covering all index-linked products, please contact:

Simon Côté
514 879-5379
Since in May 2013 the monthly rise of the composite index was 1.1%, this May's 0.8% rise meant that 12 month home price inflation decelerated 0.3 percentage points to 4.6%, where it was in March. For the third month in a row, prices were down from a year earlier in all four markets east of Toronto: Quebec City (−1.6%), Ottawa-Gatineau (−1.4%), Montreal (−1.2%) and Halifax (−0.4%). In Victoria prices were flat from a year earlier. The 12-month rise trailed the countrywide average in Winnipeg (+1.0%) and Edmonton (+2.6%) and led it in Hamilton (+5.9%), Toronto (+6.0%), Vancouver (+8.2%) and Calgary (+8.7%). The softness of prices east of Toronto is consistent with the excess supply prevailing in the resale markets of these metropolitan areas. That being said, market conditions are generally balanced elsewhere, and are even tight in Calgary.

Teranet – National Bank House Price Index™


The historical data of the Teranet – National Bank House Price Index™ is available at www.housepriceindex.ca.
Metropolitan areaIndex level
May
% change m/m% change y/y
Calgary181.291.1 %8.7 %
Edmonton175.850.6 %2.6 %
Halifax142.073.1 %-0.4 %
Hamilton148.802.0 %5.9 %
Montreal149.160.5 %-1.2 %
Ottawa139.500.0 %-1.4 %
Quebec175.541.6 %-1.6 %
Toronto157.161.3 %6.0 %
Vancouver180.470.0 %8.2 %
Victoria133.79-0.1 %0.0 %
Winnipeg195.51-0.3 %1.0 %
National Composite 6162.160.8 %5.1 %
National Composite 11162.500.8 %4.6 %
The Teranet–National Bank House Price Index™ is estimated by tracking observed or registered home prices over time using data collected from public land registries. All dwellings that have been sold at least twice are considered in the calculation of the index. This is known as the repeat sales method; a complete description of the method is given atwww.housepriceindex.ca

The Teranet–National Bank House Price Index™ is an independently developed representation of average home price changes in six metropolitan areas: Ottawa, Toronto, Calgary, Vancouver, Montreal and Halifax. The national composite index is the weighted average of the six metropolitan areas. The weights are based on aggregate value of dwellings as retrieved from the 2006 Statistics Canada Census. According to that census1, the aggregate value of occupied dwellings in the metropolitan areas covered by the indices was $1.168 trillion, or 53% of the Canadian aggregate value of $2.207 trillion.

All indices have a base value of 100 in June 2005. For example, an index value of 130 means that home prices have increased 30% since June 2005.
By:
Marc Pinsonneault
Senior Economist
Economics and Strategy Group
National Bank of Canada
Teranet - National Bank House Price Index™ thanks the author for their special collaboration on this report.
1 Value of Dwelling for the Owner-occupied Non-farm, Non-reserve Private Dwellings of Canada.

Wednesday, May 14, 2014

Teranet House Price Index - April 2014

HOME PRICES UP 0.5% IN APRIL

In April the Teranet-National Bank National Composite House Price Index™ was up 0.5% from the previous month, following a flat March. Though the gain might appear robust, it must be said that apart from the recession in 2009, the composite index always advanced in April, the average monthly increase having been 0.9%. Last month's advance is indeed the third weakest for April outside a recession since 1999. Though the countrywide composite index rose to an all-time high, only four of the 11 metropolitan markets surveyed did the same. Prices were up from the previous month in nine markets. Calgary's 1.5% advance was the third in a row exceeding 1%, taking that market to a new high. Montreal's monthly gain of 0.8% was far from making up the ground lost in March. Prices in Hamilton, Halifax and Ottawa-Gatineau were up 0.7% on the month. The rise in the national capital region ended a run of seven monthly retreats. The rise in Halifax left its index still below the January reading. The monthly gain was 0.6% in Edmonton, 0.5% in Vancouver (the only city whose prices have risen for 12 consecutive months, also to a new high), 0.4% in Winnipeg and 0.3% in Toronto. These last two markets reached new highs although their advances trailed the countrywide average. Two markets were down from the previous month, Quebec City (−0.5%) and Victoria (−1.0%).

Teranet – National Bank National Composite House Price Index™

Contact Us

For general enquiries:

info@housepriceindex.ca

For licenses covering all index-linked products, please contact:

Simon Côté
514 879-5379
Since in April 2013 the monthly rise of the composite index was the smallest on record (+0.2%), the rather modest advance of April 2014 resulted in an acceleration of 12 month home price inflation to 4.9% from 4.6%. However, for the first time since October 2010, prices were down from a year earlier in five of the 11 markets, including all four of those east of Toronto: Halifax (−3.5%), Quebec City (−2.4%) and Montreal and Ottawa-Gatineau (−0.4%). The fifth market with 12-month deflation was Victoria (−0.7%). In striking contrast were 12-month gains of 10.0% in Calgary and 9.0% in Vancouver. Toronto (+5.8%) and Hamilton (+5.3%) also pulled the cross-country average higher. Trailing the average were Edmonton (+4.0%) and Winnipeg (+2.5%). The softness of prices east of Toronto is consistent with the excess supply prevailing in the resale markets of these metropolitan areas.

Teranet – National Bank House Price Index™


The historical data of the Teranet – National Bank House Price Index™ is available at www.housepriceindex.ca.
Metropolitan areaIndex level
April
% change m/m% change y/y
Calgary179.391.5 %10.0 %
Edmonton174.880.6 %4.0 %
Halifax137.750.7 %-3.5 %
Hamilton145.920.7 %5.3 %
Montreal148.370.8 %-0.4 %
Ottawa139.490.7 %-0.4 %
Quebec172.74-0.5 %-2.4 %
Toronto155.150.3 %5.8 %
Vancouver180.520.5 %9.0 %
Victoria133.88-1.0 %-0.7 %
Winnipeg196.000.4 %2.5 %
National Composite 6160.940.6 %5.5 %
National Composite 11161.280.5 %4.9 %
The Teranet–National Bank House Price Index™ is estimated by tracking observed or registered home prices over time using data collected from public land registries. All dwellings that have been sold at least twice are considered in the calculation of the index. This is known as the repeat sales method; a complete description of the method is given atwww.housepriceindex.ca

The Teranet–National Bank House Price Index™ is an independently developed representation of average home price changes in six metropolitan areas: Ottawa, Toronto, Calgary, Vancouver, Montreal and Halifax. The national composite index is the weighted average of the six metropolitan areas. The weights are based on aggregate value of dwellings as retrieved from the 2006 Statistics Canada Census. According to that census1, the aggregate value of occupied dwellings in the metropolitan areas covered by the indices was $1.168 trillion, or 53% of the Canadian aggregate value of $2.207 trillion.

All indices have a base value of 100 in June 2005. For example, an index value of 130 means that home prices have increased 30% since June 2005.
By:
Marc Pinsonneault
Senior Economist
Economics and Strategy Group
National Bank of Canada

Thursday, April 03, 2014

Greater Vancouver Market Snapshot March 2014

Below are updated sales, inventory, months of inventory, and sell-newlist ratio graphs for Greater Vancouver to March 2014. (See REBGV news releases.) (Click on images to enlarge.)

My estimates for March were for inventory of 14565 (actual 14472) and sales of 3127 (actual 2641) based on estimating average changes from February of years 2005-2013. Using the same technique estimates inventory and sales for April of 15620 and 2785 respectively (MOI=5.6).

Friday, March 14, 2014

Teranet HPI - February 2014

HOME PRICES UP 0.3% IN FEBRUARY

In February the Teranet-National Bank National Composite House Price Index™ was up 0.3% from January. For the second month in a row, prices for Canada as a whole rose to an all-time high, though new records were set in only two of the 11 metropolitan markets surveyed - Vancouver (for a fourth straight month) and Calgary (for the first time since September 2007). Since in February 2013 the index was down 0.2% from the month before, the increase of February 2014 resulted in an acceleration of 12 month home price inflation to 5.0% from 4.5%. The gain from a year earlier was well above the cross-country average in two of the 11 markets, Calgary (9.6%) and Vancouver (7.7%). It was slightly above the average in Toronto (6.1%) and Edmonton (5.3%), equal to the average in Hamilton (5.0%) and below it in Winnipeg (3.5%) and Montreal (1.9%). In Halifax (−4.7%) and Ottawa-Gatineau (−0.6%), prices were down from a year earlier for a second consecutive month. In Victoria (−3.4%), home prices have been down from a year earlier for 12 months now. Quebec City posted its first 12 month deflation in 15 years (−2.0%). It is the first time since October 2009 that there is price deflation in at leat four of the regions covered.

Teranet – National Bank National Composite House Price Index™

Contact Us

For general enquiries:

info@housepriceindex.ca

For licenses covering all index-linked products, please contact:

Simon Côté
514 879-5379
In February the east-west dichotomy became more pronounced than ever. Home prices were up from the month before in all five markets of Western Canada - Calgary (1.1%), Vancouver and Victoria (0.9%), Edmonton (0.6%) and Winnipeg (0.5%). The rise in Victoria ended a run of four consecutive monthly declines. For Vancouver it was the 10th consecutive monthly increase. In the six markets of central and eastern Canada, the only monthly rise was in Montreal (0.7%), the second advance after six months of flat or declining prices. Prices were down 0.1% in Toronto, making February the fourth month without a gain in the last six. For Ottawa-Gatineau (−0.8%) it was the sixth decline in a row, for Quebec City (−1.7%) the sixth in seven months. For Halifax (−1.7%) it was the third decline in a row.

Teranet – National Bank House Price Index™


The historical data of the Teranet – National Bank House Price Index™ is available at www.housepriceindex.ca.
Metropolitan areaIndex level
February
% change m/m% change y/y
Calgary174.341.1 %9.6 %
Edmonton173.180.6 %5.4 %
Halifax135.69-1.7 %-4.7 %
Hamilton145.97-0.5 %5.0 %
Montreal149.970.7 %1.9 %
Ottawa139.29-0.8 %-0.6 %
Quebec173.53-1.7 %-2.0 %
Toronto154.67-0.1 %6.1 %
Vancouver178.470.9 %7.7 %
Victoria134.700.9 %-3.4 %
Winnipeg194.840.5 %3.5 %
National Composite 6159.990.3 %5.6 %
National Composite 11160.410.3 %5.0 %
The Teranet–National Bank House Price Index™ is estimated by tracking observed or registered home prices over time using data collected from public land registries. All dwellings that have been sold at least twice are considered in the calculation of the index. This is known as the repeat sales method; a complete description of the method is given atwww.housepriceindex.ca

The Teranet–National Bank House Price Index™ is an independently developed representation of average home price changes in six metropolitan areas: Ottawa, Toronto, Calgary, Vancouver, Montreal and Halifax. The national composite index is the weighted average of the six metropolitan areas. The weights are based on aggregate value of dwellings as retrieved from the 2006 Statistics Canada Census. According to that census1, the aggregate value of occupied dwellings in the metropolitan areas covered by the indices was $1.168 trillion, or 53% of the Canadian aggregate value of $2.207 trillion.

All indices have a base value of 100 in June 2005. For example, an index value of 130 means that home prices have increased 30% since June 2005.
By:
Marc Pinsonneault
Senior Economist
Economy & Strategy Group
National Bank of Canada
Teranet - National Bank House Price Index™ thanks the author for their special collaboration on this report.

Monday, March 10, 2014

January 2014 Residential Construction Activity - Vancouver CMA

Below are CMHC starts, completions and under construction for Vancouver CMA to January 2014. Starts and completions are displayed as 12 month sums (included February preliminary housing starts):
Here is single detached under a microscope, including completed but unabsorbed units:
While single detached starts and completions are below levels seen before the recession, units under construction and unabsorbed inventory are both higher. These datasets do not indicate where single detached units are being built, but many if not most will be on previously unoccupied land, the remainder will be infill. Rumours of "strength" in "single family" house prices in certain areas do not align well with these data.

Another point to make is that CMHC-reported "single detached" will include houses with secondary suites. Houses with occupied secondary suites that were counted as "single detached" by CMHC and municipalities are counted as multifamily by Statistics Canada when performing census dwelling counts. Interestingly those same dwelling counts will count laneway houses as "single detached" (which of course they are since they share no walls, ceilings or floors with anyone but the mice).

Wednesday, March 05, 2014

Price Changes, Sales and Inventory

A recent foray of activity in recent business news feeds has uncovered a slightly revised outlook on Canadian housing from investment shop PIMCO. Articles can be traced through Luke Kawa's article. What it seems to have boiled down to is an expectation that national prices could fall -20% to -10% in real terms (I'm assuming a 2% inflation rate) over about five years, though this could possibly happen faster. Taking the view that such a correction is going to occur over five years we can infer what this will mean for sales and inventory.

In Vancouver, sales and inventory have a relationship to price changes. Here is a graph showing annualized price changes versus the ratio of for-sale inventory to monthly sales (months of inventory AKA MOI) since 2005:
The relationship between MOI and price changes is clear however the variance is substantial. Using a baseline assumption of MOI of 7 leading to flat nominal prices and an MOI of 10 leading to -5% nominal annualized price changes, we can determine what level of increased inventory and decrease in sales is required to elicit the price drops conducive to PIMCO's -20% to -10% real call. (This is not to say that Vancouver will be in-line with the national average but the analysis is here as an example.) I have colour coded the results. Results are based on changes from current sales and inventory levels (that are around MOI=6.5).

MOI resultant from changes in sales and inventory from current levels:

Nominal annualized price changes based on inventory and sales changes

Real price changes over five years based on inventory and sales changes


The above charts are concentrating on the scenarios discussed by PIMCO. This is not to suggest that their estimates are realistic; price increases are certainly possible but not considered in the charts.

We can use the charts as follows:
To get a -10% real drop over five years, that would require:
  • an average increase in inventory of 10% with a 0% change in average sales
  • an average increase in inventory of 5% with a 5% change in average sales
  • an average increase in inventory of 0% with a -10% change in average sales
To get a -20% real drop over five years, that would require:
  • an average increase in inventory of 30% with a 0% change in average sales
  • an average increase in inventory of 15% with a -10% change in average sales
  • an average increase in inventory of 0% with a -25% change in average sales

An interesting observation is how little sales and inventory need to move (inventory up 15% and sales down 10%, say, albeit for a prolonged five year duration)  to change a slightly-increasing market (the current scenario) to one that will be down -20% in five years.

Tuesday, March 04, 2014

Greater Vancouver Market Snapshot February 2014

Below are updated sales, inventory, months of inventory, and sell-newlist ratio graphs for Greater Vancouver to February 2014. (See REBGV news releases.) (Click on images to enlarge.)

The scatterplot of 6 month price changes and months of inventory is below. The most recent datum is the orange dot at about (MOI=6.2,price_change=5%) . The trend is roughly in line with past years.

My estimates for February were for inventory of 13637 (actual 13412) and sales of 2527 (actual 2530) based on estimating average changes from January of years 2005-2013. Using the same technique estimates inventory and sales for March of 14565 and 3127 respectively (MOI=4.7).

Thursday, February 20, 2014

Canadians increasingly regard home as retirement nest egg

I guess this isn't really a shock but the number of people counting on their home to fund their retirement is a lot higher than I would have guessed and I am not so sure it will work out the way most people expect.

Canadians increasingly regard home as retirement nest egg

Doing some quick math:


  • Sell home in Surrey: $500,000 
  • Buy Condo or Townhouse: $300,000 
  • Invest or purchase annuity with remainder: $200,000 gets a lifetime monthly payment of $1,100 for a 65 year old male 

I'm not sure that is exactly the kind of retirement that they were expecting.  I fully expect many retirees to return to work or stay at work.