Showing posts with label demand. Show all posts

Wednesday, August 28, 2013

Population Growth and Residential Construction Activity in BC

(This is the first in a three part series analysing population growth and construction activity in BC. See the second and third parts.)

There is an obvious correlation between housing activity and population growth. Since the 1980s one can see the ebbs and flows of population growth, alongside housing starts and completions, have been a normal occurrence in BC's history. The second graph puts population growth in a longer historical perspective for posterity.

 
The best correlation is between housing completions and population growth, however there are two behaviours, one pre-2000 and another post-2000. Pre-2000 there were approximately 0.22 completions per person of growth, with a 1 quarter lag (ie population growth rises and falls one quarter before completions). Post-2000 there were approximately 0.33 completions per person of growth with a 3 quarter lead (ie population growth rises and falls three quarters after completions).
Some clues as to why there is a difference should be evident by observing the fraction of detached completions of the total has been dropping since the early 1990s in Vancouver that makes up the majority of residential construction activity in the province.

Notes:
  • Though it's not immediately evident from the data, by visual inspection, there is arguably a "baseline" 10,000 units built each year to maintain the existing stock of housing for the existing population. That is, if population growth were zero there would still be a turnover demand of around 10,000 units per year.
  • The number of completions per person of growth after 2000 corresponds to 0.33, or about 3 people per completion. Before 2000 this was 4.5 people per completion. It looks as if the shift to multi-unit construction at least partially accounts for this difference.
  • As a rough rule of thumb, if population growth is 30,000 this results in annual housing demand of 20,000. Over the course of BC's history since the 1960s, 30,000 is a typical nadir. Most recent population growth has been around 40,000, which corresponds to a demand of about 22,000-25,000 units. Current completion rate is near the high end of this range but the number of starts suggests the number of completions will not markedly deviate from current population growth.
  • Population projections typically do not account for the variability in year-to-year population growth but concentrate on averages. Population growth has averaged 60,000 and completions have averaged 28,000 since 1965. Growth projections are about 55,000–60,000 until 2035 based on BC Stats analysis. Population growth cycles with a period of about 10–15 years.
I track population growth closely as it aligns with residential construction activity, GDP growth, and new and used housing sales and for-sale inventory.

Tuesday, October 04, 2011

Central 1 B.C. Housing Forecast 2011-2013

Report available here (PDF). Excerpts (emphasis mine):

A key characteristic of the post-recession housing market has been the divergent housing strength between the Lower Mainland and most other areas of the province. While the Lower Mainland-Southwest and, to a lesser extent, the Capital region had shown relatively stronger post-recession sales activity, most other regions remained at recessionary levels. The impact of low interest rates was more benefi cial for real estate markets in larger, diversifi ed economies with a higher proportion of local area buyers. In addition, employment growth was generally weaker outside of the Metro Vancouver region.
On overvaluation in the Lower Mainland:
It has become fashionable to suggest that price levels in Lower Mainland-Southwest region of the province, and particularly Greater Vancouver, are set to correct substantially due to the significant price gains in recent years and a de-linking of home prices relative to income and rental rates. Central 1 does not subscribe to this view, but does expect price gains to slow considerably over the forecast horizon. While price levels may turn lower in the near term, the annual Lower Mainland-Southwest median resale price level in 2012 is forecast to surpass 2011 by 1.4% to reach $497,000. A further gain of 3.6% is forecast in 2013 Central 1 deems a significant price correction in the Lower Mainland-Southwest to be unlikely for various reasons. First, much of the price growth in the region has been attributed to disproportionately strong demand for higher priced single-detached product in localized regions such as the west side of the City of Vancouver and Richmond. In contrast, price gains have been less substantial in other markets and product types, meaning this has not been a region-wide price surge. Moving forward, demand will likely remain stable as economic growth, albeit slow, persists and mortgage rates remain low.

In addition, speculative demand in the region remains low. The proportion of units re-sold within six months of purchase can be used a proxy for speculative activity. In theory, speculators look to gain through capital appreciation over a shorter time-frame relative to home-owner occupiers. In a period of higher speculation, which is generated by strong market activity and price gains, this proxy generally rises. However, this metric has exhibited a declining trend since early 2008, currently hovers near 2% and operates near normal levels. In contrast, this proxy surpassed 10% in the late 1980s, and was closer to 6% in 2006 when markets were overheated. The lack of excessive speculation suggests that we are unlikely to see a speculation-induced bust in pricing.

Meanwhile, price levels will be further supported by supply-side adjustments. Sales activity and the flow of new listings are positively correlated – when demand increases, new listings tend to follow in the months that follow. The opposite is also true. This reflects the tendency of sellers to capitalize on strong markets and rising prices, and sit tight when market conditions weaken. In the absence of any major shock in the economy such as a large and unexpected increase in interest rates or another recession, Central 1 expects the recent slowdown in demand to be met by declining listings activity, which will mitigate growth in standing inventory of resale product.
On population growth:
Weak population growth through 2013 will be a limiting factor for housing over the forecast horizon. The provincial population is forecast to expand at a lackluster rate of 1.1% this year, and fare only slightly better in 2012 and 2013 with 1.2% growth. The slow pace of growth will reflect a drop in the number of landed immigrants to B.C. from international markets this year and increased net outflow of residents to other provinces, primarily Alberta, in 2012 and 2013. This interprovincial net outflow reflects the stronger rebound in Alberta’s economy and improved labour market conditions.
On interest rates:
Mortgage rates will remain low and edge up beginning in the latter half of 2012 and through the remainder of the forecast horizon. This reflects a compression of bond yields, which have recently declined sharply in the U.S., Canada, and Germany during the latest round of market concerns and volatility. The U.S. central bank has stated that it expects no rate increase until mid-2013 and only then if conditions warrant.
I do not necessarily endorse this view in full; nonetheless the data presented are worthy of review. Personally I would give greater weight to price-rent ratios but to each his own. House purchases come with obligations lasting longer than to 2013. Place your bets.

Wednesday, March 02, 2011

Bifurcation of the BC Real Estate Market

No, bifurcation isn't a an intestinal disorder although it could cause some consternation (not constipation) among some observers who expect uniform behaviour across various real estate markets.

Based on market behaviour since the 'flash crash' of 2008/2009, we could draw a clear line between the urban market of Greater Vancouver and the rest of the province. The City of Vancouver and its immediate suburbs have witnessed a frenetic pace of home buying activity and consequent price rises.

This is in a pretty marked contrast to the real estate markets of the Fraser Valley, Vancouver Island, and the rest of BC. While prices have risen substantially in the area covered by the REBGV this past year, they have fallen or remained relatively flat in many markets including the Fraser Valley, Chilliwack, Okanagan, Northern Interior, etc. thus bifurcation.

Why?

Quite simply, I think it just comes down to supply and demand. The Greater Vancouver real estate market has inelastic supply and demand that is relatively stable. When the market is hot, supply becomes even more constrained as holders of real estate hang on for further gains rather than listing. Demand is increased as potential buyers feel like they are 'getting left behind' and the ratios of supply and demand drive prices higher. This, of course, can work in reverse, which is what we witnessed during the 'flash crash' of 2008/2009 and I expect we will witness a rather severe and perhaps more prolonged version again soon.

What do you think? When might this happen?

Note: The Landcor 2010 Report paints the same picture: https://www.landcor.com/market/reports/2010_Residential_Sales_Summary.pdf

Tuesday, May 04, 2010

Fraser Valley Real Estate - April 2010

Here are the charts:

Active listings are increasing at the same pace as 2008.


Sales are still brisk but May could mark a turning point as it did in 2008.


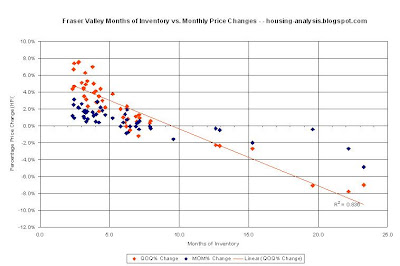
Months of inventory is at the high side of normal and looks to be matching 2008. It will take a drop in sales to get to the extremely elevated levels of market distress we saw in 2008.


Correlation between MOI and price changes is extremely robust and we should be looking for price decreases through the summer if normal seasonal patterns hold up.

Monday, January 18, 2010

Ubergeek Post Update December 2009 - Price Changes and Months of Inventory in GVREB

Here is a quick update on the work mohican and I did in spring 2008 around refining mohican's work tracking price changes and months of inventory. Remember that the best fit was to track half-over-half (i.e. 6 months over 6 months) price changes to a three month moving average of months of inventory (total active listings at the end of the month divided by the sales in that month).

Here is mohican's scatter plot for half-over-half versus 3 month moving average MOI, updated inclusive December 2009 data:


The correlation still exists, and another small step closer to the designation of "law". We can see how well the model has behaved.


Months of inventory was extremely low through the second half of 2009, an odd event in history when unemployment is rising. There was a step-change in affordability due to low mortgage rates, coupled with a lack of tightened requirements for loan qualifications. Are there other plausible reasons for low inventory and high sales? Last year's about-face happened across Canada but unique local factors still play a role.

What will 2010 bring for BC housing? There are several portents.

- There are musings on the wind of tightening mortgage requirements which will have some impact on demand.
- Interest rates are predicted to rise the second half of this year. We'll see. Low interest rates will reduce the chances of a price collapse but will not prevent prices from falling.
- Rental demand looks to remain weak. With the Olympics finishing in 45 days or so we may see some extra rental supply and, perhaps, extra for-sale supply as well.
- Unemployment is unlikely to decrease through 2010. Government budgets, at all three levels, are under stress. The pool of money grows increasingly thin, as one would expect as the world continues to de-leverage, though the process appears to be a drawn-out affair.

Sunday, November 08, 2009

Saturday, July 04, 2009

Ubergeek Post Update June 2009 - Price Changes and Months of Inventory in GVREB

Here is a quick update on the work mohican and I did in spring 2008 around refining mohican's work tracking price changes and months of inventory. Remember that the best fit was to track half-over-half (i.e. 6 months over 6 months) price changes to a three month moving average of months of inventory (total active listings at the end of the month divided by the sales in that month).

Here is mohican's famous scatter plot for half-over-half versus 3 month moving average MOI (the red dot is June 2009's datum):


Remarkably the correlation is disturbingly accurate into the downturn. Looking forward we can see how well the model has "predicted" the next month's price movements.


Weak-minded fool that I am, I second-guessed myself and thought the benchmark would come in at $690K, though if I had stuck to the model I would have been closer. I am at a loss to explain the reason for how well this model has done in Vancouver. Other cities where I have tried to run similar analysis show nowhere near as tight a correlation between months of inventory and price changes. Since the causation underlying this model is not well understood the model is interesting but not much more -- it will track until it doesn't.

If you're flabbergasted by the market's recent strength, consider affordability has improved close to 30% in the past year (thanks for pointing this out, fish10). That's a Brobdingnagian shift, even with aggregate incomes coming under severe pressure.

Saturday, May 30, 2009

No Charts for You!

The kids are napping and I've got only a few seconds to post before going out to enjoy the sun so no charts today.

CMHC released complete April housing data for Vancouver and Abbotsford last week.

Here are the highlights:

Year to Date Starts 2008 - 6691
Year to Date Starts 2009 - 2302

Year to Date Completions 2008 - 5540
Year to Date Completions 2009 - 5377

Under Construction April 2008 - 26253
Under Construction April 2009 - 22494

Completed but Unabsorbed 2008 - 1445
Completed but Unabsorbed 2009 - 2368

Surrey has a crapload of unabsorbed new housing (754 units) and many more units on the way (5344 units under construction).  

Monday, April 06, 2009

Fraser Valley Real Estate - March 2009

The Fraser Valley Real Estate Board released their March statistics package last week and here are some of the highlights:

There were 1006 residential real estate transactions in the Fraser Valley. Sales were up from February but down significantly from previous years.


Active Listings are quite high and will likely rise through the spring and summer.


Months of inventory is at an elevated level of 9.8 and will likely remain at or around this level for the next two months before rising for the remainder of the year.

The FVREB House Price Index, in an uptrend for the past 4 years, has now fallen significantly from peak levels last spring. Even with an uptick the last couple months we are at 2006 price levels. We will see if prices hold up or not this year.


Months of Inventory has a high correlation with price changes and at the current and expected future inventory levels through the remainder of the year we should see continued negative pressure on prices.

Thursday, April 02, 2009

Vancouver Real Estate - March 2009 Charts

Active Listings were basically flat from February. Mostly because sales were quite a bit higher.


Sales rose dramatically from February but are still seasonally low compared to the boom years.


Consequently, the Sales to Listings Ratio improved during March but is still dramatically lower than the boom years.


The number of Months of Inventory is obviously low and is undergoing the expected seasonal variation.


The correlation between the months of inventory and the price changes is tremendously strong.


I expect April and May to be fairly similar to March - flat prices and a relatively stable inventory and sales picture. I fully expect sales to fall in the normal seasonal patter after that which will cause inventory to balloon further. This will raise the number of months of inventory and consequently prices will go down further.

We are 15.8% or $121,979 from the peak detached benchmark values and I don't see that changing too much over the next couple months. Things should get interesting during the late spring and during the summer months.

Thursday, March 05, 2009

Fraser Valley Real Estate - February 2009 Stats

The Fraser Valley Real Estate Board posted the February 2009 Statistics package and here it is on the down low.

Sales stink like the fresh manure smell that permeates the Valley many days! Sales are at levels not seen since the 1980s.

Active Listings are quite high for this time of year and seem to be rising in the normal seasonal pattern.


Since sales rose a bit from January the number of months that it would take at the current sales rate to sell all the homes for sale in the Fraser Valley dropped to 'only' 14 months. This means that if you are trying to sell a home right now, it might take a while unless you drop the price - a revolutionary idea to be sure - this whole supply / demand equilibria thing.

The benchmark price has fallen 13% in 9 months now with more price drops to come it seems.


The correlation between the supply / demand situation and price changes is strong. If prices are to increase substantially anytime soon it will take a massive rise in sales, large reduction in active listings or both for this to change.
By performing some simple seasonal analysis it seems that months of inventory will probably bottom this year at the 7-9 MOI level in either April or May. This does not indicate upward price pressure and by later in the year we could be looking at some very significant price declines. The Fraser Valley is on track to lose another 15% or so in 2009. There are potential events that could influence the market in either direction as well.

Tuesday, March 03, 2009

You Are Still Winners Vancouver!!

REBGV released monthly housing market data for February 2009 here.

You might feel like a real loser for buying those 4 presale condos at the Woodwards building that you are really underwater on now but you can rest easy knowing that Vancouver is a 'winning city.' We are still winning the fastest real estate price decline from peak of any North American market but it really looks like we are going to have to pick up our socks if we are to maintain that lead. Come on now Vancouver, let's give Miami something to talk about.


Sales are still in the figurative toilet and we can expect them to rise for the next 2 or 3 months as the normal seasonal variations of activity in the real estate market take place.


Active listings are at super elevated levels before the spring listing rush.


The ratio of sales to active listings is low, really low.


Months of inventory is high, really high.


The tight correlation between months of inventory and price changes continues to be tight. Tighter than white on rice.


Prices are still in a downward trend.


Good luck with those Woodwards condos, I'm going fishing.

Sunday, February 22, 2009

Vancouver CMA CMHC Data - January 2009

The illustrious Canada Mortgage and Housing Corporation released the housing market data for markets across the country last week and here is a synopsis of the Vancouver data.


Starts are falling off a cliff. Only 609 units were started in January 2009 compared to 1332 in 2008.

Completions are accelerating now with 1431 units completed in January compared to only 838 last year.

Units under construction are at near peak levels but falling rapidly as completions outpace starts.

All of the current completions are coming into an oversaturated market now and the number of unabsorbed (unsold) units is continuing to rise. The number of unabsorbed units finished January 2009 at 2401 compared to 1407 last January.

Vancouver real estate market = toast, getting blacker by the day.

Wednesday, February 04, 2009

Fraser Valley Real Estate Market - January 2009

From the Fraser Valley Real Estate Board:

"A total of 389 sales were processed through Fraser Valley’s MLS® in January, a decrease of 59 per cent compared to 956 sales in January 2008 and comparable to January sales figures last seen in the early 1980s, according to statistics from Fraser Valley Real Estate Board’s Multiple Listing Service." Wow!


Active listings are really high for January.


Months of inventory is sky high to begin the year.


Prices in the Fraser Valley have been dropping now since May 2008 and prices are now back at July 2006 levels.


The correlation between months of inventory and price changes is exceedingly strong through the bust so far.
Stay tuned, more price declines to come.

Saturday, January 31, 2009

Chilliwack Realtors in the Poorhouse

What follows my comments here is a puff piece from the Chilliwack and Districk Real Estate Board president Trude Kafka. I gather she is in deep denial about the current real estate market or is trying to put on a brave face. Either way, it isn't helping.

The upper Fraser Valley real estate market is being crushed under the burden of 24 months of inventory with exceptionally low sales volumes coupled with sky high inventory. There are over 280 realtors in the board's area and there were only 67 property sales in the month of December which by my elementary math means that there were over 200 realtors going hungry during the month of December. Perhaps we should start a collection so they are able to make their Lexus payments.

Total MLS® sales activity increased in December 2008, while residential sales activity declined in the area served by the Chilliwack and District Real Estate Board, according to statistics released by the Board. The Board's MLS® system recorded $23,492,025 worth of sales this December. That's a nine per cent increase from the total posted this past November, and a 49 per cent drop from the total in December 2007.

A total of 67 properties traded hands through the Board's MLS® system in December 2008, which is 12 per cent lower than the total from November and 55 per cent less than in December 2007.

"It’s no surprise that sales slow down during the final quarter of the year," said Board President Trude Kafka. "This trend is not unique to our region. However, we did see an increase in total MLS® sales – despite a monthly decline in total MLS® property listings. Property values continue to increase in our region. Hopefully these trends will continue well into 2009."

The total value of home sales recorded through the Chilliwack and District Real Estate Board's MLS® system this December was $18,999,700 – which is nine per cent lower than the total from November 2008, and 52 per cent below the amount posted in December 2007.
In all, 63 homes were sold through the Board's MLS® system this December. That's 15 per cent lower than in November, and 49 per cent less than last December.

The average price of homes sold through the Board's MLS® system this December was $301,583, which is seven per cent above the average from November 2008 and five per cent lower than the average from December 2007. The Board cautions that the average residential price is a useful figure only for establishing trends and comparisons over a period of time. It does not indicate an actual price for a home due to the wide selection of housing available in the area.

The Chilliwack and District Real Estate Board handled a total of 2,224 MLS® sales in 2008, a sharp decline of 37.2 per cent compared to the total number of MLS® properties sold in 2007. All of the 12 real estate Boards and Association in British Columbia processed a total of 74,484 properties through their local MLS® systems, representing a 33.4 per cent decline from the total properties sold in 2007. The MLS® properties sold through the Chilliwack and District Real Estate Board had a total value of $699.4 million, representing a 35.4 per cent decrease compared to 2007. Provincially, the value of all MLS® properties sold in 2008 had a total value of $33 billion, a 30.9 per cent decline from 2007 levels.

2,036 of the MLS® properties sold locally in 2008 were residential, down 37.7 per cent from the number of residential MLS® properties sold in 2007. Provincially, the number of residential MLS® properties sold declined 33 per cent compared to 2007. Residential properties sold locally in 2008 had a total value of $643.8 million, sinking 34.2 per cent compared to 2007. On the provincial level, total residential MLS® sales in British Columbia in 2008 had a value of $33.1 billion, a 30.6 decrease from record-setting 2007 levels.
There were 5,482 new listings processed through the MLS® system of the Chilliwack and District Real Estate Board in 2008, an 11.4 per cent increase compared to the number of new listings processed in 2007. Provincially, the number of new residential listings in 2008 increased 12.1 per cent compared to 2007 to 176,762 properties.

A total of 181 new residential listings were added to the Board's MLS® system this December, an 18 cent increase from December 2007. As the month came to an end, there were 1,524 active residential listings on the Board's MLS® system.

The Chilliwack and District Real Estate Board is an association of 283 REALTORS® that provides services to and sets standards for members. The Chilliwack and District Real Estate Board serves Chilliwack, Agassiz, Hope, Boston Bar and Harrison.

Tuesday, January 06, 2009

Greater Vancouver Prices Decline Dramatically for 7 Months in a Row

Data from REBGV Press Release.

2008 certainly was an interesting year for real estate market observers in Vancouver. For nearly 2 years the local market bucked the declining price trends seen in the US and elsewhere. Pundits had proclaimed that the local market was immune or insulated from the turmoil elsewhere. Oh how wrong they were. Benchmark detached home prices in the Greater Vancouver area are now at the same level as they were in June 2006.

This story is really all about supply and demand. There is lots of supply with even more coming and very little demand. Active listings are significantly above previous year's levels so the supply side is not helping those who want higher prices.


One may look to the demand side of the equation for some hope for some price appreciation but monthly sales are at half the level they were during the boom years with no quick fixes in sight.

Consequently, it would take a very long time, 16.4 months to be exact, for the current level of inventory to be sold off at the current rate of sales. This essentially means that the market is completely saturated with product and the only sales to be seen are the deep discounts.


The correlation between months of inventory and price changes is extremely tight with any MOI level above 7 MOI indicating further price declines. At the current level of more than double that, I do not expect rising prices anytime soon.

As mentioned previously, prices are now back at mid-2006 levels and the retreat has only begun. I fully expect inventory to swell in the new year and sales to continue at a lacklustre pace which will put continued and significant negative price pressure on sellers for the next while.


Good luck to everyone.