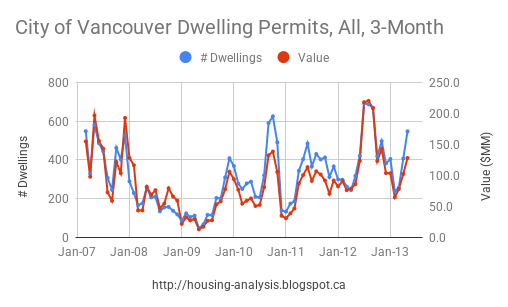
Residential dwelling permits graphed since 2007:
 Multi-unit building permits:
Permits parsed for 1-2 dwelling units only (i.e. single family, single family with suite, and duplex):
Value per permit, multi and 1+2:
Below are 12 month moving average 1+2 dwelling permits plotted with the Teranet HPI. There is a 6 month shift in permit data due to the 12 month averaging filter; if one accounts for that the correlation is 0.95. Something to think about.
(Note: graph not started from zero to highlight correlation)
No comments:
Post a Comment