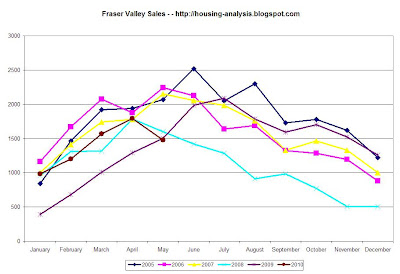
Sales were 1477.

Active Listings were 11,411 at the end of May.

Months of Inventory rose significantly to 7.7 MOI which puts the FV solidly into price decline territory.

The MOI relationship with price changes is extremely robust as evidenced by May with a MOI of 7.7 and a price decline of -0.8 for the benchmark of all residential properties changing hands in the month.


7 comments:
Those numbers are what I would call "slightly bearish."
Down goes Fraser Valley!!
Nice work Mohican! Great analysis. The next few months will be exciting.
Thanks for the stats, Mohican!
I've figured it out... The reason for the poor sales last month was... The Horizon Deepwater disaster! BP's problems caused the entire stock market to wobble, thus freaking people out and preventing them from buying. Yep.
On another note: how's the starts/completions chart looking these days?
I would say 'robustly bearish!' especially considering the trend.
M - I have been so busy at work lately that I have not kept the CMHC data up to date but it is on my list of things to do!
Anyone looked at the REBGV stats yet?
http://tinyurl.com/28mlmdw
The 5 percent drop doesn't seem to be anywhere except for the average house price chart at the bottom. They use a 3 month moving average in the first table of statistics. Without the chart at the bottom it seems it would be nearly impossible to tell what is going on on a monthly basis? Am I missing something? Seems weird.
Post a Comment