Showing posts with label CMHC. Show all posts

Tuesday, October 09, 2018

Metro Vancouver Housing Construction Activity Update September 2018

The stalwart Metro Vancouver housing starts and completions graph (conceived by Van Housing Blogger over a decade ago) has been updated for including preliminary housing starts data from September 2018:


The total number of starts has continued to be very strong through 2018. Completions have increased to record highs the past year, and it is reasonable to assume that many of these have started showing up, directly or indirectly, on the MLS-brokered market and have contributed to a moderate increase in new listings for used homes. In my previous post I noted that the market has cooled and we may not be free of this weakness for some time (though who knows for sure?). Developers might be "building into" a protracted downturn.

These graphs highlight how unprecedented current construction activity is. This activity has led to acute shortages for trades and backlogs in approving permits and inspections. This should come as no surprise to anyone — this is how market cycles are supposed to work. 

What is of interest to policymakers and governments here is how long it takes to render new supply onto the market. Not shown here is the time required to acquire land, plan the site, rezone, and get approval; the actual "project start" is far in advance of the starts shown in the graphs above. Ramping up supply takes years, but a sudden change in demand can occur in a single season. In addition, historically when units don't sell, there is significant impedance to commence new starts or even the preamble work, which makes it very difficult to keep a steady supply of abundant housing in the pipeline to prevent shortages, at least not without significant supplementary government intervention. I am concerned some facile interpretations of housing economics may not be well versed in the grim realities of recessions and how difficult it is to maintain over-supply and thus bypass the shortage portion of the cycle. Food for thought.

Wednesday, July 27, 2016

CMHC Assessment Points to Potential Impact of Home Price Growth in Vancouver and Toronto on Canadian Market

OTTAWA, July 27, 2016 – Evidence of problematic conditions in Canada’s housing market as a whole has increased from weak to moderate since the last report, according to the latest Housing Market Assessment (HMA) released today by the Canada Mortgage and Housing Corporation (CMHC). ). In Vancouver, we now have sufficient evidence to raise our overall assessment of problematic conditions in the Vancouver housing market to high.

The HMA serves as an early warning system, alerting Canadians to areas of concern developing in our housing markets so that they may take action in a way that promotes market stability.

Report Highlights

  • Overvaluation and overbuilding remain the most prevalent problematic conditions observed across the 15 centres covered by the HMA.
  • Overvaluation is detected in 9 centres while overbuilding is detected in 7.
  • Overall evidence of problematic conditions has increased since the previous assessment nationally as well as in Vancouver.
  • Strong evidence of problematic conditions is seen in Vancouver, Toronto, Calgary, Saskatoon and Regina. In Toronto and Vancouver, this is due to the combination of price acceleration and overvaluation. In Calgary, Saskatoon and Regina, this is due to the combination of overvaluation and overbuilding.
  • Moderate evidence of problematic conditions is seen nationally as well as in Edmonton, Winnipeg, Hamilton, Montreal, and Quebec.
  • Evidence of overvaluation has increased since the previous assessment nationally and in Hamilton.
  • Overall evidence of problematic conditions has decreased in Ottawa since the previous assessment.
CMHC defines evidence of problematic conditions as imbalances in the housing market. Imbalances occur when overbuilding, overvaluation, overheating and price acceleration, or combinations thereof depart significantly from historical averages. For examples, please consult the Overview section of the national report.
The complete HMA, including national, regional and CMA insight and analysis, is available on ourwebsite.
“For Canada overall, we now detect strong evidence of overvaluation. As a result, our overall assessment has moved from weak to moderate since the last report. Moreover, the greater range of evidence of problematic conditions in Vancouver has led us to conclude that there is now strong evidence of problematic conditions in our overall assessment of the Vancouver housing market.”
— Bob Dugan, Chief Economist, Canada Mortgage and Housing Corporation
Robyn Adamache
“Right now we're seeing moderate evidence of overheating and price acceleration in Vancouver because supply is not keeping pace with demand. We're also continuing to see strong evidence of overvaluation mainly because single detached home prices are higher than those supported by economic fundamentals.”
— Robyn Adamache, Principal Market Analyst (Vancouver), Canada Mortgage and Housing Corporation

Information on This Release:

Jonathan Rotondo
Media Relations
613-748-2734
jrotondo@cmhc.ca

Wednesday, December 03, 2014

An In-depth Look at the Canadian Housing Market

by Tom Bradley, Steadyhand Investment Funds
In the last couple of weeks, there has been two excellent reports published on the Canadian housing market – one by the Canada Mortgage and Housing Corporation (CMHC) and the other by RBC Global Asset Management. Both are good reads for people who want to dig into the detail and get a better understanding of the many factors that drive housing prices and activity.
Both reports draw conclusions that are consistent with what the real estate industry and banks are saying – there are some signs of strain in the market, but the risks are more benign than what the doomsayers like me are suggesting.
CMHC’s fourth quarter assessment provides an overview of where we are today (price trends, sales to listings ratios, unabsorbed inventory levels and vacancy rates on rental units). Overall, the report concludes that the Canadian market is not overbuilt and overheated, and only moderately overpriced.
Despite the conclusion, I find the CMHC report less useful in addressing what lies ahead. It uses some sophisticated modeling to measure current valuation, but the interest rate cycle is not discussed. Given that house prices are highly geared to changes in interest rates, some sensitivity analysis would have been useful.
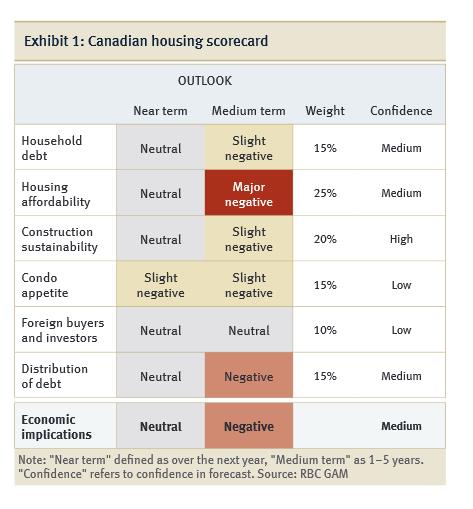
The RBC report is very thorough and attempts to address all of the doomsayers’ concerns. There are many interesting charts, including the scorecard below:

I find the author’s conclusion (Chief Economist Eric Lascelles) to be surprising in light of this scorecard. He says, “Broadly, the near-term outlook appears benign, tilting only slightly in a negative direction.” Yes, the near-term is holding up OK, but there’s nothing benign about his 1-5 year outlook.
I learned a lot from both reports, but they didn’t change my view. There are a number of factors that weren’t discussed or need more emphasis:
  • House prices hinge on mortgage rates that are, by any measure, well below normal levels. Basing the price of an asset on another asset that is overpriced (bonds) is a scary proposition.
  • Pricing and market psychology will not be determined by the 72% of homeowners who have more than 25% equity in their house. Rather, it will be driven by the 5% who have less than 10% equity. The mistake forecasters made in the U.S. a decade ago was taking comfort from the majority instead of being wary of the weak minority.
  • What is bothersome is the number of factors that are in negative territory. It’s possible to explain away one or two ratios that are off trend (which Eric does well), but when there’s a wall of them, it gets to be a stretch.
  • Even the most positive of analysts have trouble pointing to any factors that are highly positive. The best either report can do is ‘neutral’. In my mind, it’s hard to make a case for investment when there are no positive indicators to offset the risks.
  • There’s little recognition in either report of how good the environment has been. These are not normal times. Housing prices have had a howling tailwind at their back – subsidized mortgage rates, abundant credit, a growth spurt in the buying cohort (25-34 year olds), rising home ownership and foreign buying. In a few years, we’ll look back and marvel at how good everything was.
  • And the one I feel most confident about – extreme cycles don’t end with ‘benign’ corrections. It just doesn’t happen.

Copyright © Steadyhand Investment Funds

Sunday, June 15, 2014

April 2014 Residential Construction Activity - Vancouver CMA

Below are CMHC starts, completions and under construction for Vancouver CMA to April 2014. Starts and completions are displayed as 12 month sums (included May preliminary housing starts):
No signs of a downturn...


Monday, March 10, 2014

January 2014 Residential Construction Activity - Vancouver CMA

Below are CMHC starts, completions and under construction for Vancouver CMA to January 2014. Starts and completions are displayed as 12 month sums (included February preliminary housing starts):
Here is single detached under a microscope, including completed but unabsorbed units:
While single detached starts and completions are below levels seen before the recession, units under construction and unabsorbed inventory are both higher. These datasets do not indicate where single detached units are being built, but many if not most will be on previously unoccupied land, the remainder will be infill. Rumours of "strength" in "single family" house prices in certain areas do not align well with these data.

Another point to make is that CMHC-reported "single detached" will include houses with secondary suites. Houses with occupied secondary suites that were counted as "single detached" by CMHC and municipalities are counted as multifamily by Statistics Canada when performing census dwelling counts. Interestingly those same dwelling counts will count laneway houses as "single detached" (which of course they are since they share no walls, ceilings or floors with anyone but the mice).

Wednesday, October 23, 2013

September 2013 Residential Construction Activity - Vancouver CMA

Below are CMHC starts, completions and under construction for Vancouver CMA to September 2013. Starts and completions are displayed as 12 month sums:
The first graph below is completed but unabsorbed inventory for single and semi detached properties, the second graph is showing the sum of single and semi detached under construction and completed but unabsorbed, which provides a proxy for near-term inventory of new properties of that type. (Single and semi-detached typically have construction cycle of less than a year.)
By the unabsorbed plus under construction measure, single and semi detached inventory has been at a level unseen since the early 1990s since early 2013.

Monday, July 08, 2013

May 2013 Housing Starts and Permit Data - Vancouver CMA

Here is the chart for housing starts, completions, and under construction for Vancouver Census Metropolitan Area (CMA) to May 2013:

Below we can see a continued high level of multi-unit construction compared to detached construction. The long-term trend for detached construction has been down.
The last three years have seen an increasing amount of starts and under construction volume, the former of which now looks to have crested. Completions are trending upwards, as expected -- completions typically lag starts, so if starts are trending higher that will likely mean completions will trend higher as well. 12 months of completions are now 30% above the trough in 2011. (The actual trough was in early 2011.) With this increased level of completions, and what looks like either a plateaued or further-increasing level of completions into this year, we can expect increased competition among sellers continuing through 2013, as compared to 2012.

Despite recent resale malaise starts remain healthy -- at least not morbid -- pointing to continued construction activity -- and new supply -- over the coming quarters. Units under construction remain high.

Completed and unabsorbed for single and semi detached dwellings have eclipsed the highs seen during the last recession. I have plotted the completed and unabsorbed inventory as a percentage of the last 12 months of completions, to give a rough gauge of what percentage of single detached houses are unabsorbed compared to the completion rate. A high number of completed and unabsorbed is not necessarily cause for alarm if the total construction volume is high as well. The latter graph partially accounts for this.


Completed and unabsorbed as a percentage of a year's completions is as high as during the 2008-2009 recession.

Next, 12 months of Lower Mainland and BC permit data, both number of permits and value:
Notice the divergence of permits since mid-2010 between Vancouver and the rest of the province. Vancouver's population growth has remained more robust than the rest of the province of late, and it looks like one of the reasons for this has been increased residential construction activity.

Monday, June 10, 2013

April 2013 CMHC Data - Vancouver CMA

Here is the chart for housing starts, completions, and under construction for Vancouver Census Metropolitan Area (CMA) to April 2013 with May 2013 preliminary housing starts:

Below we can see a continued high level of multi-unit construction compared to detached construction. The long-term trend for detached construction has been down.
The last three years have seen an increasing amount of starts and under construction volume, the former of which now looks to have crested. Completions are trending upwards, as expected -- completions typically lag starts, so if starts are trending higher that will likely mean completions will trend higher as well. 12 months of completions are now 30% above the trough in 2011. (The actual trough was in early 2011.) With this increased level of completions, and what looks like either a plateaued or further-increasing level of completions into this year, we can expect increased competition among sellers continuing through 2013, as compared to 2012.

Despite recent resale malaise starts remain healthy -- at least not morbid -- pointing to continued construction activity -- and new supply -- over the coming quarters. Units under construction remain high.

Completed and unabsorbed for single and semi detached dwellings have eclipsed the highs seen during the last recession but are below levels seen in the 1990s.

Wednesday, May 15, 2013

The Vancouver Condo Price-Rent Ratio

A method of measuring relative valuation is to look at price-rent ratios, a "price-earnings" ratio for real estate. Vancouver does not have a market rent index, however CMHC does provide rental survey data that I have quickly validated to be close to prevailing rents. The price is garnered from the Greater Vancouver MLS-HPI (note the MLS-HPI before 2005 uses a different base so I "stitched" the two indexes as best I could). The results are normalized for Jan 2005 below:
The red line has been slowly falling from 2008 onwards, most recently the drops have been from an equal combination of rising rents and falling prices. The historical bound for price-rent ratio before 2000 has been between about 70 and 90. As an estimate, say the price-rent ratio is to revert to this historical bound in five years. What average annualized price change is required to do this?
Rents have averaged about 2.5% annual gain since the 1990s. Under this scenario, five years of -2.5% nominal price changes will put the price-rent ratio within historical bounds. To get to the middle of this range would require a more hearty -5% annualized nominal price change. If rental growth slows due to slow income growth or oversupply, price drops would need to intensify.

Monday, May 13, 2013

Changing Uninsured Amortizations to 25 Years

Some rumours abound of maximum amortization lengths for uninsured mortgages being set to 25 years as a form of macroprudential easing of relative excesses in the Canadian housing market. To quantify this change, and put it in recent historical perspective, I have graphed the change in affordability relative to 2000 for a fixed income and debt-service ratio, using prevailing average mortgage rates for both insured and uninsured mortgages. Currently 30-year amortizations for uninsured mortgages are possible, but if these were dialled back to 25 years, the effect on maximum loan affordability is evident:
It should be clear that the proposed changes are not announced or in force, but we can see in recent months the gap between uninsured and insured loan affordability has widened. If prices are to fall an uninsured mortgage can quickly become insured, hence, likely, the consternation in Ottawa of this gap. If amortizations were to change from 30 to 25 years this amounts to an affordability drop of 10%, and a halving of the insured-uninsured affordability spread from 24% to 12%.

Tuesday, April 23, 2013

The Effect of Overt Macroprudential Policy and Interest Rates on Borrowing

A quick and dirty gauge is to ask, given current interest rates and rates used for loan qualification requirements, what is the amount of loan a borrower can get via a conventional mortgage? To answer this, we can normalize for income level and debt-service ratio and look at the effects on maximum loan qualification for both insured and uninsured loans. I have normalized the results to January 2000:
The amount of loan has depended upon macroprudential policies relating to maximum amortization lengths and minimum downpayment ratios. These two have tracked well until 2010 when the government required using posted, not discounted, rates to qualify for government-insured loans. The most recent overt macroprudential measure was to reduce the maximum amortization for an insured loan to 25 years from 30 years. I have assumed uninsured loans can still get 30 year amortizations. 

This is for a generic "prime" borrower; DSR and other qualification limits will be imposed based on lenders' internal risk management policies (that have notably changed of late) that will not show up in this graph above.

Nonetheless it is stark how accommodative uninsured loans are in the current environment, and how stiff the "posted" rate has been since mid-2012 despite the significant pressures on yields. Finance Minister Jim Flaherty recently took to strong-arming banks to ensure they did not change their posted five-year rates. If banks were allowed to lower the posted rate the red line on the graph would be higher.

As it stands in the current environment an insured borrower can qualify for about 33% more loan than was the case in 2000, income-adjusted. An uninsured borrower can now qualify for an impressive 65% more loan.

Tuesday, April 09, 2013

February 2013 CMHC Data - Vancouver CMA


Here is the chart for housing starts, completions, and under construction for Vancouver Census Metropolitan Area (CMA) to February 2013 with March 2013 preliminary housing starts:

Below we can see a continued high level of multi-unit construction compared to detached construction. The long-term trend for detached construction is down.
The last three years have seen an increasing amount of starts and under construction volume, the former of which now looks to have crested. Completions are trending upwards, as expected -- completions typically lag starts, so if starts are trending higher that will likely mean completions will trend higher as well. 12 months of completions are now 30% above the trough in 2011. (The actual trough was in early 2011.) With this increased level of completions, and what looks like either a plateaued or further-increasing level of completions into this year, we can expect increased competition among sellers in 2013 compared to 2012.

Despite 2012's resale malaise starts remain healthy, pointing to continued construction activity -- and new supply -- over the coming quarters. Units under construction remain high.

On the unit absorption front here is completed and unabsorbed for single and semi detached dwellings.

Wednesday, January 09, 2013

November 2012 CMHC Data - Vancouver CMA

Here is the chart for housing starts, completions, and under construction for Vancouver Census Metropolitan Area (CMA) to November 2012 with December 2012 preliminary housing starts:


Below we can see a continued high level of multi-unit construction compared to detached construction. The long-term trend for detached construction is down.
The last three years have seen an increasing amount of starts and under construction volume, the former of which now looks to have crested. Completions are trending upwards, as expected -- completions typically lag starts, so if starts are trending higher that will likely mean completions will trend higher as well. 12 months of completions are now 30% above the trough in 2011. (The actual trough was in early 2011.) With this increased level of completions, and what looks like either a plateaued or further-increasing level of completions into next year, we can expect increased competition among sellers in 2013 compared to 2012. 

On the unit absorption front here is completed and unabsorbed for single and semi detached dwellings. When I track down the dataset for multi I'll put together a graph on it. There is an enigma in some of my data, indicating that unabsorbed inventory may be under-reported. I'll have more on this in the coming weeks.


Tuesday, November 27, 2012

October 2012 CMHC Data - Vancouver CMA


Here is the chart for housing starts, completions, and under construction for Vancouver Census Metropolitan Area (CMA) to October 2012:
Below we can see a continued high level of multi-unit construction compared to detached construction. The long-term trend for detached construction is down.


The last three years have seen an increasing amount of starts and under construction volume. Completions are trending upwards, as expected -- completions typically lag starts, so if starts are trending higher that will likely mean completions will trend higher as well. 12 months of completions are now 30% above the trough in 2011. (The actual trough was in early 2011.) With this increased level of completions, and what looks like either a plateaued or further-increasing level of completions into next year, we can expect increased competition among sellers in 2013. 

This is some analysis we can use to help formulate some predictions for the Vancouver housing market in 2013.

Saturday, October 20, 2012

You Can Still Get A Lot Of Loan

Canadian Finance Minister Jim Flaherty was quoted recently:

"Speaking on CBC Radio, Flaherty said he had no plans to take further action to take froth out of the housing market, after a series of moves to tighten conditions for mortgage lending. The most recent change was in July.
“We’ve done enough, I do not intend to do any more,” Flaherty said, adding that he was pleased at signs of a slowdown in key sectors of the market, like the condo market in the big cities of Toronto and Vancouver."
The government, through OSFI and CMHC have enacted a series of changes to mortgage underwriting guidelines and mortgage insurance qualifications so as to attempt to make credit more dear. I believe the most recent efforts have been made more urgent because real rates on the 5 year bond have been negative for several months.

An interesting exercise is to compare how much loan a borrower can get for a conventional 5 year term mortgage amortized over the maximum allowable, assuming debt service ratios and incomes are flat. To show this effect I have calculated the maximum loan amount a borrower can take assuming a fixed payment and fixed income. I have normalized the results. This shows the effect of amortization and interest rates on how much loan can be taken:
In 2000 interest rates were higher than today and then fell through most of the early 2000s. In late 2006 the government changed maximum amortization lengths to 40 years. This was subsequently pared back to 35 years in 2008, then to 30 years in 2011. In addition there was a change where insured mortgages must qualify under the posted, not actual, rate. Finally, in July 2012 the government reduced maximum amortization length to 25 years on insured mortgages only. (Uninsured mortgages can still obtain 30 year amortizations.)

Despite the recent round of amortization pullbacks the maximum affordability is still well above levels seen in the early 2000s. Compared to January 2000, a borrower can obtain 32% more insured loan and 61% more uninsured loan.

The gap between uninsured and insured mortgages is stark. If prices are coming off their highs and continue to show weakness, uninsured loans will start to become insured as loan-to-value (LTV) ratios start increasing. Given the discrepancy between uninsured and insured loans, that will hit the market hard, so hard I expect a reversal of recent moves to tighten lending, in some form, if prices continue to trend weaker.

While the government may want to protect the interests of taxpayers from future liability, if it's like any other asset bubble in history, that goal is likely not realistic. In my view the question has always been how the government is going to have Canadians consume (read: eat) poorly-performing mortgage debts.

Friday, October 12, 2012

August 2012 CMHC Data - Vancouver CMA


Here are the charts for housing starts, completions, and under construction for Vancouver Census Metropolitan Area (CMA) to August 2012, with September preliminary housing start data:
The last few months have seen a continued lag of completions and an increasing amount of starts and under construction volume. Completions are trending upwards but the delay relative to starts is on the long end of what has occurred historically. We should anticipate an eventual increase in completions through the remainder of 2012 and into 2013.

Below we can see a continued high level of multi-unit construction compared to detached construction.

Monday, October 08, 2012

We're All Subprime Now

I have been continually hearing that Canadians and Canadian lenders have been more prudent in lending than their American counterparts. I was more than a little interested to read:

The Province: Tighter mortgage rules thwarting sales

Pauline Kendall owns three houses and a condominium but she couldn’t get financing this summer when she tried to add to her real estate holdings.
The East Vancouver resident says the federal government’s new mortgage rules have complicated financing for self-employed people such as herself and for first-time buyers.
“I was a little bit shocked,” says Kendall, 62, who put in an offer on a home she had her eye on in July but had to pull back when the only option was expensive refinancing of the home in which she lives.
Kendall sees it as the ”federal government trying to protect us from ourselves.”
“It’s interesting times to have four properties in East Vancouver and not having a bank interested [in financing a purchase],” said Kendall, who works as general contractor and as a landlord for her properties.
Her homes “average out” to be worth $1 million each and the condo is worth close to $500,000.
“Now, no matter what we own, how much equity we have, we just don’t fit under the new rules,” she said.
Apparently recent changes to income qualification and amortization lengths are throwing wrenches into fancy plans. Just throwing it out there, if Vancouver prices are indeed as high as American housing expert Robert Shiller is claiming -- the same message this and other blogs have been calling out for over five years now -- perhaps those mountains of equity local property investors claim to have may be a tad ephemeral, and loaning more money to one whose ability to service loans depends heavily upon the cut and thrust of the local real estate market may be somewhat against "prudent" risk management guidelines.

It certainly seems the federal government is "trying to protect us from ourselves".

(Note: title taken from Calculated Risk)

Thursday, September 13, 2012

July 2012 CMHC Data - Vancouver CMA


Here are mohican/VHB's charts for housing starts, completions, and under construction for Vancouver Census Metropolitan Area (CMA) to July 2012, with August preliminary housing start data:
The last few months have seen a continued lag of completions and an increasing amount of starts and under construction volume. Completions are trending upwards but the delay relative to starts is on the long end of what has occurred historically. We should anticipate an eventual increase in completions through the remainder of 2012 and into 2013.

Here is a breakdown of the new persons per bedroom start and completion, assuming 4 bedrooms per detached and 1.6 bedrooms per multi. The higher the number the more population growth there is per start/completion and this would tend to lead to higher unit absorption. In contrast a lower value would mean less absorption. As we can see Vancouver new persons per bedroom-start continues to trend lower once again, in part due to lower population growth of late.
Below we can see a continued high level of multi-unit construction compared to detached construction.

One of the risks facing Vancouver and BC GDP growth is a continued below-trend population growth due in part to unemployment differentials with other parts of the country, in turn wrought by over-investment, particularly in residential structures. If this event occurs, one need only refer to the early 2000s to see the starts and completions are likely to head, and what that would mean for construction employment and BC's GDP growth.

Should population growth remain subdued, resulting lower GDP growth of future years would, in my view, be most reasonably attributed to previous investment excesses, not then current conditions.

Thursday, August 09, 2012

Unabsorbed Detached Units in Vancouver CMA

An anomaly has presented itself in some CMHC data regarding matching the completed, absorbed, and unabsorbed datasets available through Statscan's CANSIM tables. First a bit of background on the data I'm using:

  • "Completed" is the number of units that have been registered as being completed in a given month.
  • A unit is "absorbed” is when a binding, non-conditional agreement is made to buy or rent the dwelling.
  • "Unabsorbed inventory" is the total number of units that have not been absorbed.
  • "Completed but unabsorbed" is the number of units that completed but were not absorbed in a given month.
"Unabsorbed inventory" (U) is theoretically derived from "completed" (C) and "absorbed" (A) as follows (where i is a given month and i-i is the previous month):
U[i] = U[i-1]+C[i]-A[i]

So taking the reported unabsorbed inventory and reconstructing it using completed and absorbed data should produce a match. CANSIM data are only available for single and semi detached properties so these are the data I have used. Alas they don't seem to track very well in absolute terms:
The reason for the divergence is unclear but a much more interesting thing arises upon visual inspection: the higher-frequency terms appear to track each other closely. To isolate this effect I added a first order highpass filter with 6 month time constant and yield the following result:
Indeed for most of the series over the past 24 years the higher frequency terms are similar, except in the past 18 months or so where the reported absorbed inventory has fallen markedly short of reported completions, but this is not showing up in the reported unabsosrbed inventory.

I'll leave it for CMHC to figure out what's going on before making any speculations, but for those tracking unabsorbed inventory when looking for potential distress in housing markets, this should be something that should be resolved. If I can find the multi-unit absorbed/unabsorbed datasets I'll add to the analysis to see if this effect carries over. (Multi-unit is a much more significant component of Vancouver CMA's construction activity; detached is about 25% in terms of dwelling completions in the past few years.)