So many things to post about and I don't have time to look at them closely.
1. China's in a huge bubble and the government is trying to stop it.
2. Mortgage rates are going up for the second time in two weeks and Bank of Canada prime rate is likely to rise soon. Watch out variable rate mortgage holders.
3. Median price data has its faults when looking at a falling real estate market
Talk about what you want.
Wednesday, May 30, 2007
Monday, May 28, 2007
Historical Median Home Prices: California Cities vs. Vancouver
Vancouver's real estate market has often been compared to various markets in California, including Los Angeles, San Diego and San Francisco.
UPDATE (thanks jmk for the stats tips):

I am now showing analysis using the Case Shiller Price Index and the UBC CUER Data based on annual price change calculations. The correlation between Vancouver and Los Angeles is 0.40; San Francisco is 0.22; San Diego is 0.29; Composite is 0.20; and Calgary is 0.38. I also did correlation analysis for Portland and Seattle. Portland is 0.22 with Vancouver. Surprisingly Seattle is has a correlation coefficient of only 0.0559 with Vancouver.
I found historical median price data for San Francisco, Los Angeles and San Diego and here is the comparison between Vancouver and those markets. I have adjusted Vancouver's prices for the difference between the US and CDN currencies based on historical exchange rates in the year in question.

Saturday, May 26, 2007
Mortgages
Some facts about the current mortgage market in Canada (from CAAMP):
1. Over 70% of Canadians choose fixed rate mortgages
2. Over 20% have variable rate mortgages
3. The remaining % have combination mortgages
For the mortgages currently held by Canadians, the average mortgage interest rate is 5.1%, a rise from the 4.9% recorded a year earlier. This average rate is quite similar to the rates that are currently available for new and renewed mortgages. However, of course, individual circumstances vary:
• If rates remain at current levels, 66% would face increased interest rates at their next renewal, 32% would have decreases, and 1% would have no change in their interest rate.
• For those scheduled to renew in the next 12 months 50% would have increased interest rates, 48% would have decreases, and 2% would have no change.
• If rates were to increase by one-half of a percentage point from current levels, 74% of borrowers would face a rate increase at their next renewal; among those renewing in the coming 12 months, 58% would see increases.
BC mortgage holders are the most likely to have a variable rate mortgage at 32% as compared to 21% for all of Canada.
The average variable rate mortgage has gone from 4.4% last year to over 5.3% this year.
Here is an updated renewal gap chart.

Thursday, May 24, 2007
Home of Insanity - Bridgeview

I have been following the irrational run up in real estate prices for two years now and I have been saying that real estate is overvalued based on fundamentals of price to rent ratio and price to median income ratios (traditional and reliable valuation methods). Despite the fact that I know this to be true, most of the people I talk to on a daily basis think that it is rational and that somehow it makes sense. They usually bring up low mortgage rates, booming economy, rising population, etc and I am quite frankly tired of hearing about their irrational reasons. These ideas have been rationally refuted time and time again and I'm not going to go into that now.
Most people don't live in my world of statistics, analysis and mathematical rigour - they understand stories. The stories they've been hearing lately are about relentlessly rising property values, get rich quick speculators, and the glories of refinancing the family home. Since these people understand stories I am going to provide a story to back up my point of view. I plan to profile MLS listings in Greater Vancouver and the Fraser Valley over the next while to prove my point. I will call these homes "Home of Insanity."
Today's leveraged investor special (MLS F2708994) is found in the lovely Bridgeview area of north Surrey. It is a 1000 square foot rancher and the seller is asking "only" $285,000. It rents for $1000 / month and the monthly carrying costs of the property would be approximately $2000 / month. You can have the opportunity to subsidize a renter to the tune of $1000 / month by buying this property. I wonder why the current landlord is selling?
If you decide to buy this property you will have the pleasure of seeing your home underwater during a 50 year flood and seeing homeless people, hookers, drug addicts, and gang violence right outside the front door. Clearly this home is also of a "timeless" character because we don't even know when it was built. Before you call the realtor to make an offer, remember to bid above asking price because this home is close to Home Depot, Skytrain, and yes - even scrap metal yards - right around the corner.
Wednesday, May 23, 2007
Mill closures...
Canfor has indefinitely closed its Mackenzie mill-- CBC news.
The company's interim president and CEO, James Shepard, said Tuesday he had been directed by the company's board to cut costs "and position the company to weather this market downturn, which is the worst this industry has seen in decades."
The company's interim president and CEO, James Shepard, said Tuesday he had been directed by the company's board to cut costs "and position the company to weather this market downturn, which is the worst this industry has seen in decades."
Tuesday, May 22, 2007
Demographic Effects on House Prices
100 posts, 57,000 visitors and counting. Thank you to all of the readers and commenters who make blogging here a joy and good exercise for my brain.
I just finished reading a respectable article on the impact of demographics (baby boom) on interest rates, consumption, and housing prices. The article, published November 2005 by Robert Martin, is available at the US Federal Reserve website.
I won't bore you with the detailed analysis - it is extensive and barely understandable for a layman (including me) - but essentially the outcome of his analysis is that US home prices are affected dramatically by demographics because of the effects on productivity, consumption, and interest rates. The conclusion of the study is that US house prices are due to fall approximately 30% in real terms over the next 50 years.
To quote (on pages 26 and 27 ):
"The model gives a gloomy view of house prices going forward. . . . In the near term, house prices will peak in level terms sometime between 2005 and 2010, the exact date of the peak turns out to be sensitive to the calibration. . . . Indeed the date of the collapse itself . . . can be moved as early as 2008. . . . Following the peak, (real) house prices decline over 30 percent in value over the next 50 years. While this number seems quite large, it must be placed in perspective. Real house prices fell almost 20 percent in the three years following the 1979 peak. Real house prices also fell around 30 percent in the United Kingdom following their 1989 peak.
Will this decline in house prices occur? There are several channels through which the results of the model could give a misleading prediction of future prices. The first and perhaps most unlikely is that the rate of productivity growth in consumption goods picks up sufficiently relative to productivity in housing output to offset the decline in labor input. Second, and more likely, is that the model assumes that agents over the age of 65 have zero productivity. This is an unrealistic assumption. Agents over the age of 65 can work and if they chose to do so in mass numbers then the timing of the downturn might be quite different. I would note that they are most likely not as productive as younger workers and almost every body agrees that at some point they will no longer be productive. Keep in mind, that while 30 percent seems fantastically large, I will show data for Japan in which the model exactly replicates the 34 percent fall in Japanese real house prices over 15 years." (look at the study for further details)

To comment on the study, it is probably the most elegant study on house prices I have ever read. It comes from a respectable source and is not likely influenced by outside interests. It is purely academic but profound in the study model's conclusions.
What do you think?
Saturday, May 19, 2007
Weekly RE Inventory Update
It looks like the annual inventory slowdown is upon us. Small accumulations of inventory this week but no big spike.


The Breakup
This goes out to all the financial planners, banks, and insurance companies out there who don't get that "IT'S ABOUT THE CONVERSATION."
Thursday, May 17, 2007
Personal Budgeting
As a financial planner I meet many different types of people, single, married, with children or without, seniors, and anyone else you can think of. Everyone has a different personal budget it seems whether its a conscious choice about how much they spend money in different categories or a 'fly by the seat of the pants' approach which is also a budget of sorts - its just really short term budgeting!
As a general rule, when I find people are in financial trouble, it is likely I will find overspending in some categories and a general lack of savings to help smooth out life's bumps and irregularities. This can be a habitual problem with many people - they spend too much and don't save enough. Many times I recommend that these people start a more rigorous budgeting procedure and a more disciplined approach to spending and consumption.
I was curious as to the average Canadian's budget so I dug up some StatsCan data and put it into a chart. The numbers are for 2005 - click to enlarge.

Generally speaking, Canadians don't save enough and they pay a lot in taxes.
And for interest sake here is my personal family budget.

I know the categories aren't the same but it is interesting to compare. I would roughly fall into the "Couple with Children" category. I spend significantly less on taxes, food, and transportation than average. I also invest and donate far more than average and I pay more on my mortgage than average. This is likely because 1) I live in the most expensive real estate market in the country and 2) I have a very short amortization period. Other differences are that I don't gamble or smoke and I don't have any education expenses.
Tuesday, May 15, 2007
North American Median Home Prices
Check it out. Hot off the press. The National Association of Realtors released home sales data for the first quarter of 2007 and the numbers are not positive. Check out the article here.

I put the median detached price data for the top 15 markets in North America into this chart and adjusted to US dollars. Greater Vancouver is the third most expensive area in North America to buy a detached home according to median price data. The Fraser Valley is lucky number 13.
Fun times, fun times. I wonder if we will make it to number one so we can be truly world class.
As an aside, since our incomes are lower than average here and mortgage interest is not tax deductible in Canada, I would suggest that we are the most expensive real estate in North America.
Saturday, May 12, 2007


Friday, May 11, 2007
BC loses 16,300 jobs in April
From CBC news, Job Growth Unexpectedly Stalls.
"British Columbia recorded a drop of 16,300 jobs following strong gains in the first three months of the year — pushing up its unemployment rate by half a percentage point to 4.4 per cent."
Wow-- a half-percent jump in the unemployment rate in just one month in BC. What types of jobs were lost? How's the forestry sector doing-- mills are still shutting down to reduce the volume of lumber they're putting onto the market-- this has got to be hitting forestry communities pretty hard. I'm sure that sector doesn't have any job growth...
May mill closures
April mill closures
March mill closures
Thursday, May 10, 2007
US Home Sales
I got a few moments today and I couldn't resist doing this cheap post. To check the in depth original here.
From John Burns Consulting - Message to Fed: Housing is Falling Much Faster than Reported
The housing market has softened much more than is being reported. We have been advising our retainer clients for more than one year about misleading national sales information, both with the Existing Home Sales and New Home Sales data. We are now going public with our concerns because we are concerned that policy makers are relying on national data to conclude that the housing market correction has not been severe.
Here is our support:

Closing Data: We purchase and compile actual home closing data for approximately 181 counties across the country, which captures the counties where about 55% of the U.S. population lives and a significant percentage of all of the counties where the large home builders are active. This data shows that sales have fallen 22% if you compare sales over the last 12 months to the prior 12 months. On a straight year over year comparison, the decline is much more.
Mortgage Bankers Association (MBA) Data: The MBA Seasonally Adjusted Purchase Application Index, which is a measure of the number of people filling out loan applications to buy a home, is down 18% from its peak in September 2005.1 With presumably more applications being filled out by borrowers who now have to shop around for a loan, how could sales have fallen by less than 18%?
Builder Data: The nation's two largest homebuilders, D.R. Horton and Lennar, are reporting that orders have declined 27% to 37%, year-over-year. 2 3 D.R. Horton and Lennar have dropped prices significantly in many markets to generate sales, while the resale market has not. How could their sales have fallen more than the resale market, even if new home communities tend to be in fringe areas?
Realogy Corporation Data: Realogy, which is the parent company of Century 21, Coldwell Banker, and ERA, participated in roughly 1.9 million brokerage related transactions in 2006 compared to 2.3 million in 2005, representing a year-over-year decline of 18% nationwide.4
2005-2006 NAR State Data: The National Association of Realtors state data does show sharp year-over-year corrections in major states: 28% drop in Florida, 24% drop in California, and a 28% drop in Arizona. Our data, however, shows the sales have probably dropped by 34%, 27% and 38%, respectively. The national numbers include some large states where sales volumes have not corrected substantially, such as in Texas and Ohio, but we believe these markets are not very healthy for other reasons. Interestingly, our calculations were tracking very closely with NAR data through 2005, as illustrated above. We did investigate NAR methodology and have found absolutely no reason to believe that the NAR is intentionally misleading anyone, as some have suggested.
New Home Data: The Census Bureau calculation of new home data does not calculate sales net of cancellations, and cancellations are running much higher than normal right now, which is why the sales numbers overestimate actual sales.
The preponderance of evidence shows that the housing market in vibrant areas where home building is prevalent has corrected much more than some people believe it has.
In summary, we believe that the Fed should know that the housing market correction has been quite steep and is also not showing signs of bottoming out, as evidenced by all of the above information, as well as significant additional research we have conducted. While the Fed has far more to consider than housing, they should know that the housing market could sure use some lower interest rates to help achieve stability soon.
Wednesday, May 09, 2007
Baby Mohican

I am taking an understandable break from the blog for a little bit to spend some time helping my wife and with the new addition to the family. He was born on Monday and he is very healthy.
M- will be holding down the fort in the meantime.
Regards.
Sunday, May 06, 2007
Saturday, May 05, 2007


Thursday, May 03, 2007
Gong Show - Gambling

I know that a lot of people have a serious gambling problem and many other people are on the verge of having a serious problem. Gambling is an unbelievably foolish behaviour and I fail to understand why it is so attractive, yet the casinos are packed, there are lineups to buy lottery tickets, and people waste billions of dollars a year on this pastime. For today's gong show, I am gonging gambling, the gaming industry, and the government for encouraging and operating the defrauding of billions.
"Canadians lost $14.5-billion to the country's gambling industry in the last fiscal year, a new study has found. The economic report commissioned by the Canadian Gaming Association found the industry made more than $15-billion in revenue last year, including $700-million on non-gambling activities such as food and drinks.The remaining $14.5-billion constitutes the amount Canadians spent on gambling activities — such as playing slot machines at casinos, buying lottery tickets and placing race track bets — minus the prize payouts. Profits were also found to be massive, pegged at $10.6-billion, including commissions and taxes. Roughly $7.4-billion enriches provincial coffers and $3.2-billion goes to charities.
The gaming industry includes casinos, lottery, horse racing, charitable gaming, bingo, slots and video lottery terminals. The study, conducted by HLT Advisory Inc., found that gaming revenues are on par with profit generated by spectator sports, television, movies, books, magazines and performing arts sectors combined."
To put the $14.5 billion into context, Canadian put $20 billion into mutual funds last year.
Update: Are you a compulsive gambler?
Did you ever lose time from work or school due to gambling?
Has gambling ever made your home life unhappy?
Did gambling affect your reputation?
Have you ever felt remorse after gambling?
Did you ever gamble to get money with which to pay debts or otherwise solve financial difficulties?
Did gambling cause a decrease in your ambition or efficiency?
After losing did you feel you must return as soon as possible and win back your losses?
After a win did you have a strong urge to return and win more?
Did you often gamble until your last dollar was gone?
Did you ever borrow to finance your gambling?
Have you ever sold anything to finance gambling?
Were you reluctant to use "gambling money" for normal expenditures?
Did gambling make you careless of the welfare of yourself or your family?
Did you ever gamble longer than you had planned?
Have you ever gambled to escape worry or trouble?
Have you ever committed, or considered committing, an illegal act to finance gambling?
Did gambling cause you to have difficulty in sleeping?
Do arguments, disappointments or frustrations create within you an urge to gamble?
Did you ever have an urge to celebrate any good fortune by a few hours of gambling?
Have you ever considered self destruction or suicide as a result of your gambling?
Most compulsive gamblers will answer yes to at least seven of these questions. Contact Gamblers anonymous for help.
Wednesday, May 02, 2007
Bubble, Bubble, Toil and Trouble
Well, the numbers are in, and I'm officially "priced out forever" in my hope of owning a house in the Fraser Valley. Obviously, houses are going to continue increasing in value until the end of the world and I've missed the opportunity to own one. Well, I could get a 40 year mortgage and rent out every room in the house to boarders . . . . hmmmmm . . . . or maybe I should give up blogging and start flipping 'luxury' condominiums in Whalley for quick profits.
Sputter, sputter, cough, cough, okay, I have my tongue out of my cheek now!
Fraser Valley Real Estate Board statistics are out for the month ending April 30th, 2007. Sales are down 5% YOY and active listing are up 51% over last year. Active listings are at the highest level in 2.5 years.

Prices are up - a lot. Median detached is $480,000, attached is $312,500 and apartments are $210,000. Those Whalley condos are hot, hot, hot.

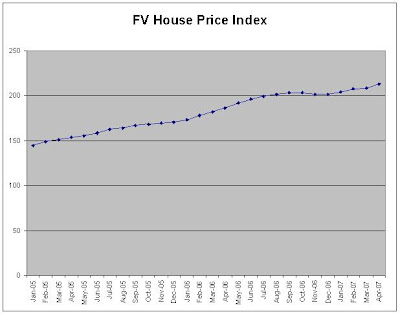
The house price index is up 2.2% MOM, 4.4% QOQ, and 14.4% YOY.
Months of inventory increased to 4.4 and the trend is up, up, up. Which means prices will go down, down, down. If this trend continues, the months of inventory will be over 10 by the end of the year. Choices galore.

The belief that these prices will hold is so prevalent now among most people I talk to and for some reason most people believe its a good thing. Contrarian psychological analysis would lead me to believe that we are very near the top of this market.
Sputter, sputter, cough, cough, okay, I have my tongue out of my cheek now!
Fraser Valley Real Estate Board statistics are out for the month ending April 30th, 2007. Sales are down 5% YOY and active listing are up 51% over last year. Active listings are at the highest level in 2.5 years.

Prices are up - a lot. Median detached is $480,000, attached is $312,500 and apartments are $210,000. Those Whalley condos are hot, hot, hot.

The house price index is up 2.2% MOM, 4.4% QOQ, and 14.4% YOY.

Months of inventory increased to 4.4 and the trend is up, up, up. Which means prices will go down, down, down. If this trend continues, the months of inventory will be over 10 by the end of the year. Choices galore.

The belief that these prices will hold is so prevalent now among most people I talk to and for some reason most people believe its a good thing. Contrarian psychological analysis would lead me to believe that we are very near the top of this market.
Tuesday, May 01, 2007
May Day, Mayday! - homes are unaffordable!
I had a discussion with a friend this morning about how much people can afford in terms of a monthly payment, because after all that is all anyone ever seems to look at.
Here we go - the most "affordable" monthly payment is with a 40 year amortization. To buy the median Greater Vancouver townhouse without a downpayment, the prospective buyer needs a gross annual income of over $95,000.

With a more conservative amortization of 30 years the buyer needs an income of over $103,000.

And with the even more conservative 25 year amortization, the buyer needs an income of over $110,000 per year, to buy a townhouse, in Burnaby or Richmond.

When I look at the income required to purchase one of these median homes, I think back to my dreams and aspirations as a younger man and dreaming of what I would be able to afford if I made $100,000 per year, which by all accounts was and still is quite a bit of money - far above the average income.
I thought about the car I could drive and the home I could own if I earned that kind of income. The car certainly isn't a problem but I'll be honest, I didn't really expect the home I could afford to be a mediocre townhouse for the education and effort required for the position that the income came with.
These are a few of my favorite things . . .
From Legg Mason Capital:
No other fund manager has duplicated Bill Miller's record of beating the S&P 500 for fifteen consecutive calendar years. Over the years, Bill Miller has received numerous accolades for his management record and distinct style, which focuses on a detailed understanding of businesses and their intrinsic value. Legg Mason's Value Equity management team was selected as a winner of Standard & Poor's/Business Week's 2002, 2003, 2004, 2005 and 2006 "Excellence in Fund Management Awards." From a universe of approximately 15,000 fund management teams, we were recognized for our "ability to demonstrate exceptional levels of leadership while consistently producing strong results over the past five years."
"You just can't use overly simplified valuation techniques to substitute for analysis and thinking. We use valuation metrics as landmarks and not roadblocks.
You don't want to have a static approach in a dynamic world"
- Bill Miller
In 2001, 2002, 2003, 2004, and 2005, and 2006, Bill Miller was ranked among the top 30 most influential people in investing when he was named a member of the "Power 30" by SmartMoney. Bill Miller was also heralded by Money magazine as "The Greatest Money Manager of the 1990's" and named Morningstar's 1998 "Domestic Equity Manager of the Year."
His unique investment management philosophy and approach to undervalued stocks has also made Bill Miller the subject of numerous profiles in publications, including The New York Times, Barron's, Business Week, Kiplinger's, Money, The Wall Street Journal, Fortune, Smart Money and Janet Lowe's book The Man Who Beats the S&P; Investing with Bill Miller.
In 1996, Legg Mason Capital Management introduced Value Equity, an institutional separate account product modeled after Bill's highly successful mutual fund, the Legg Mason Value Trust. Bill Miller and Kyle Legg co-manage the institutional separate account product. Mary Chris Gay manages related domestic and international funds.
The Value Equity portfolio typically consists of approximately thirty to fifty names that we believe trade at large discounts to our assessment of their expected value and offer the best opportunity for the highest long-term risk-adjusted rates of return. Our stock selection process focuses on companies with market capitalizations generally greater than $10 billion at the time of purchase. Adhering firmly to a value-driven, research-intensive investment process, the Value Equity team focuses on assessing expected value of companies and strives to buy stocks at significant discounts to our assessment of their worth. We assess a company's expected value by employing multiple valuation methodologies combined with rigorous business analysis, concentrating on a company's ability to generate excess cash flow, earn high returns on capital, and allocate capital efficiently. Through each stage of the investment philosophy we seek to mitigate risk through our rigorous research process, regular monitoring of business fundamentals, and appropriate diversification.
Our objective is to outperform the client’s stated benchmark, net of fees, over rolling three-year time periods. The benchmark is the cost of capital for active management.
Canadians can take advantage of Bill Miller's Value Investing style through the CI Value Trust Fund from CI Investments.
Subscribe to:
Posts (Atom)